

CIOs – Use IT Support Transparency to Drive Better Results
As a CIO, responsible for your organization’s IT support capabilities, are you happy that your IT service desk’s customer satisfaction (CSAT) scores truly represent how well it’s performing? Are you hearing all the talk about “watermelon service level agreements (SLAs),” that are green on the outside but, when cut open, are red on the inside?

Employees are potentially unhappy with the quality of IT support, despite the sea of green metrics shown in the monthly IT service desk reporting pack. Employee experience management will definitely help here, but what we’re finding is that the measurement of employee experience is paying dividends in more ways than you’d expect – starting with the transparency it delivers.
The Power of Employee Experience Data
One of the most popular aggregated views of our customers’ employee experience data is that of employee experience by channel. Which compares the email, telephone, (self-service) portal, walk-in, and chat channels in terms of employee happiness and employee lost productivity levels. A snapshot of this is shown in the chart below:

Graph taken from Q2 2020 Happiness Score™ Report.
This type of employee experience data cuts that “watermelon SLA” open to show that while an IT service desk might have a 95% CSAT score, there are many things that need to be improved upon. For instance, the above data – which is based on 345,931 employee’s feedback in the last six months – highlights that self-service portal has the lowest level of employee happiness, the highest level of employee lost productivity, and has yet to reach the level of use of the long-used email and telephone channels.
However, the important thing to note here is that by asking different questions in a different way, your service desk has the ability to better understand its current performance and results, plus the ability to identify and then address opportunities for improvement. More on this in a moment.
Comparison with B2C Companies
While the above data might not appear to be good news, for instance the high levels of employee lost productivity. It’s actually a cloud with a silver lining. Why? Because our employee experience measurement is based on the Net Promoter Score (NPS) methodology, such that your organization’s data can be compared to the NPS scores of business-to-consumer (B2C) companies. Albeit with a caveat, that there’s a need to recognize two key differences:- Our employee experience measurement doesn’t ask if the person providing feedback would recommend the organization
- B2C NPS mechanisms don’t normally solicit immediate feedback, whereas our employee experience measurement does.
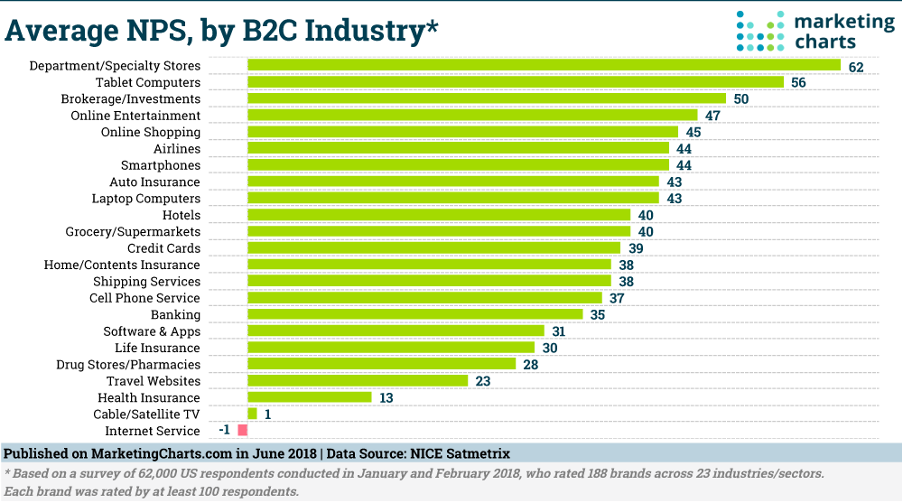
Chart source = marketingcharts.com
While it’s not shown in the channel-based view of employee experience above, the average HappySignals customer happiness score is 64 (for the mix of seasoned and new customers) – which exceeds all of the above B2C average NPS scores.
It’s something to bear in mind, and perhaps even to shout about, once you get an understanding of your employee experience. It’s the transparency that I referred to at the start of this blog.
The Importance of Transparency in Driving Better IT and Business Results
It’s interesting how our customer conversations have evolved. As the pink chart above shows, an organization could focus on improving their employee happiness score. Or on reducing the level of lost productivity – with the business case for change calling out the financial benefits of getting employees fully productive again ASAP.
However, we’ve spotted a different approach to employee experience that’s becoming more prevalent. This is a model that looks like:
Transparency -> Trust -> Focus -> Results
It’s how and why our customers are able to develop and improve their service and support capabilities and the associated employee experience. It makes the improvements a “culture thing.”
If the transparency is missing (because employee experience data is not shared openly), then it’s really hard to have trust from the business. How often have you encountered business stakeholder and employee perceptions (and facts) that are different from what your IT service desk metrics are telling you (and them)?
However, with transparency (of employee experience data) comes increased trust – which might be based on a variety of drivers. For instance, simply the fact that IT is being open about what employees think about the service and support they receive. Or the positive movements in employee happiness and lost productivity levels. Or the comparison of internal IT support results over time (trending) or with the earlier B2C NPS averages.
The transparency and trust then both help to deliver focus – including the prioritization of the improvements that will enhance both employee experience and business-level results. Whether this is through higher employee productivity levels, a better external customer experience, or something else that’s important to the organization.
Let's not Forget the Service Desk Analysts
While the above is very much focused on delivering better outcomes from IT support, we shouldn’t overlook the fact that service desk performance and any required change will be reliant on the people providing the service and support – your service desk analysts. There are two critical aspects to address here.
The first is how traditional service desk metrics drive the wrong behaviors. That, in particular, analysts are currently measured by speed and not the value they create. In practice, they’re measured on “how fast they get rid of their customers.”
The second is motivation related, and how fulfilling service desk work is. Think about it – just about every contact and conversation is related to either something not working or a need for something extra. Potentially with a less-than-happy business colleague who can’t do what they need to. Where’s the good news? And if the analyst experience isn’t also taken into consideration, what’s to say that you won’t keep losing the best IT support talent from your organization (or from your managed service provider)?
To help, the transparency provided by employee experience measurement offers a continuous feedback loop – which, if you’re doing the right things to improve the employee experience, will give analysts with near real-time positive feedback from the people they’ve just helped. Making them feel better about themselves and their work, and creating a virtuous circle where their higher motivation and better attitude then further improve their performance and outcomes.
Related content
23.05.2024
End-User Personas are Changing; What About Your IT Support Capabilities and Targets?
Is your IT service desk treating every end-user in the same way? If it is, it needs to understand the benefits of ...
Read more >
07.03.2024
Motivate your Service Desk with Experience Management Data
Service desk agents working on an IT service desk might receive negative feedback about their IT support performance ...
Read more >