IT Productivity Measurement

HappySignals measures IT productivity based on IT end-user perception, allowing for targeted improvements. Data from 1,642,555 responses indicates a 26% average increase in end-user productivity.

What do you get?

You get a real-time view into where people lose most of their productivity and the cumulative productivity gains that IT's actions have brought.


By making productivity data visible and accessible via our intuitive interface, we help you to highlight problem areas with all stakeholders, identify areas for improvement, and make data-driven decisions.

HappySignals-Productivity-Improve-UI-2

We use our Happiness Score™ metrics

Icon - Happiness Happiness

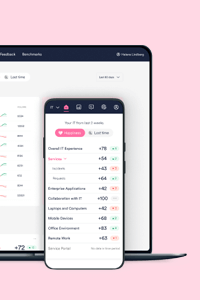
How do your end users feel?

Happiness relates to how your end-users feel about certain IT services. End-users are asked to rate their experience; this is done through a simple NPS rating system.

Icon - Product icon Productivity

How much time are your end-users losing?

Productivity is the outcome when your IT teams focus on end-user happiness. We quantify productivity by perceived productivity loss, which is much more difficult to influence than vanity metrics like process or bootup times.


Icon - Survey form Factors

Why was that?

Find out the real reasons why your end-users are happy or are losing the most time. Factors save time for IT teams since you don't have to read each free text comment, making it easier for end-users to answer.

How does Productivity Measurement work?

Experience Data is all about people, so HappySignals data is based on how people perceive their productivity loss. 

During our measurement, we ask end-users how much time they lost, not just in the process but from end-to-end, giving an honest and transparent view as IT that we care about their work time.

Lost-Time-slider-UI

survey-productivity-slider

Ask your people

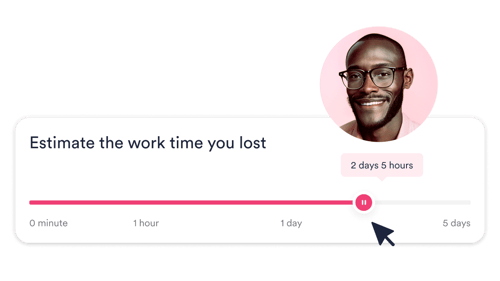
Experience-based productivity measurement means you have to ask your end-users. This is made simple with our ready-made surveys and delivery methods.


UI-continuously-monitor-improvements

Continuously measure the effects of your actions

Our continuous way of measuring daily productivity will highlight your efforts' impact, even the smallest of actions. Genuine continuous improvement needs continuous measurement.

MTTR-UI

Complement existing IT KPIs

Learn if KPIs like Availability, MTTR, Reassignment Counts, or other traditional metrics really impact end-user productivity.

13-80-image

13% of your tickets contribute to 80% of productivity loss

Based on 432,762 responses from IT end-users, you need to have Experience Data which shows you the 13% of tickets that contribute to the majority of your productivity loss.

Based on our Global IT Experience Benchmark Report.

Identify where end-users lose productivity

Expose the watermelon effect and identify services or systems where people lose most of their time.

As our Global IT Benchmark shows, you need to learn which 13% to focus on as they contribute to 80% of total lost productivity.

HappySignals can easily show you the areas where most time is lost, allowing you to prioritize your efforts.

happysignals-expose-the-watermelon-features

Find business-critical services and systems

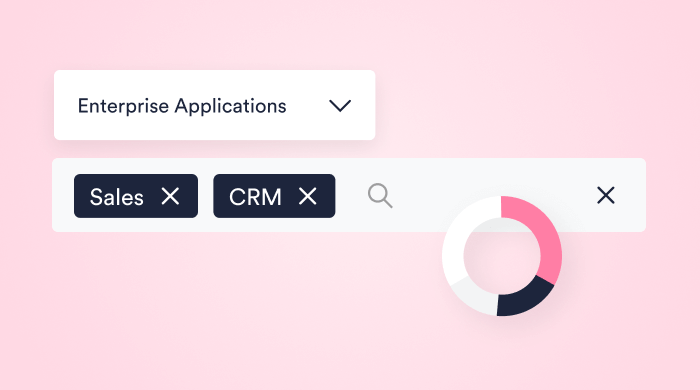
Instead of trying to fix everything, focus your IT efforts and budget on the areas where people say they are losing most of their productivity. This creates a real impact.

global-benchmark-product

Global Benchmarks

See how IT in your organization compares to our Global IT Benchmark data. Account for cultural differences in rating behavior.

watermelon-exposed

Watermelon Effect exposed

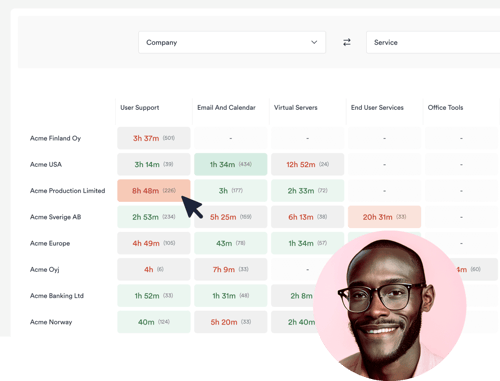
The Hotspots feature lets you learn which business units lose productivity in which services, so you can address what end-users tell you needs improving.

Lost Time is Lost Money

Many businesses are operating under the mistaken impression that cutting spending for IT has a positive effect and that the directive to “do more with less” will save the organization money.

Business icon Peter Drucker famously said, “If you can’t measure it, you can’t improve it.”

To expand on that thinking, we can say, “If we don’t measure it, we won’t improve it.” Read more here.


Roy-Atkinson-Title


HappySignals-Productivity-Improve-UI-2

Report on the real productivity gains IT has made

HappySignals makes it easy to show real productivity gains as perceived by the business.

Productivity reporting shows the end-to-end time lost by the end-users, not just the process or technology time.

Continuous measurement provides a cumulative view of the total productivity gains IT has made over a long period, as these gains cannot be made quickly.

Identify-Drill Down

What's in it for me?

Focus on your area of interest by using your operational data. Each service area can find its focus areas and report on its productivity gains, from C-level to Team Leaders.

cumulative-productivity-gains

Prove your value

Use your productivity gains to quantify the return on investment to business stakeholders or those who say IT is not doing a great job.

thanks-to-it

Celebrate your success

Traditionally IT is very focused on problems and things that don't work. Motivate yourself and your team with honest end-user feedback and their stories about improved productivity.

See how Productivity Measurement works

Watch this 2-minute demo of how HappySignals Productivity Measurement works.