Experience-driven IT Decision-making
HappySignals IT Experience Management Platform enables you to truly place your end-users at the center of IT. Get experience insights and make data-driven decisions to improve across different IT areas:
Measure experiences, share experience data, identify improvements, and improve what matters most – all on one platform.
Great IT decisions don’t come from gut feelings—they come from understanding how to create value for employees. HappySignals converts end-user emotions into actionable insights, enabling IT leaders to measure, prove, and enhance their impact.
By making human-centric, experience-driven choices, IT can drive business success, boost productivity, and create a workplace where technology truly empowers people.
Watch Platform Demo
HappySignals IT Experience Management Platform enables you to truly place your end-users at the center of IT. Get experience insights and make data-driven decisions to improve across different IT areas:
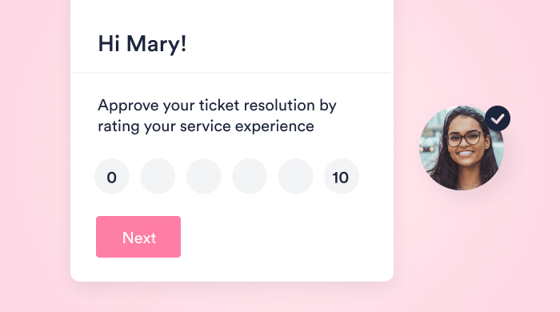
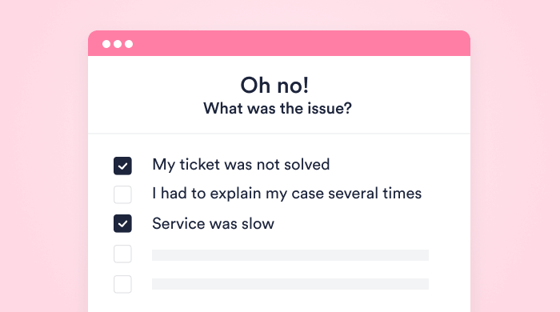
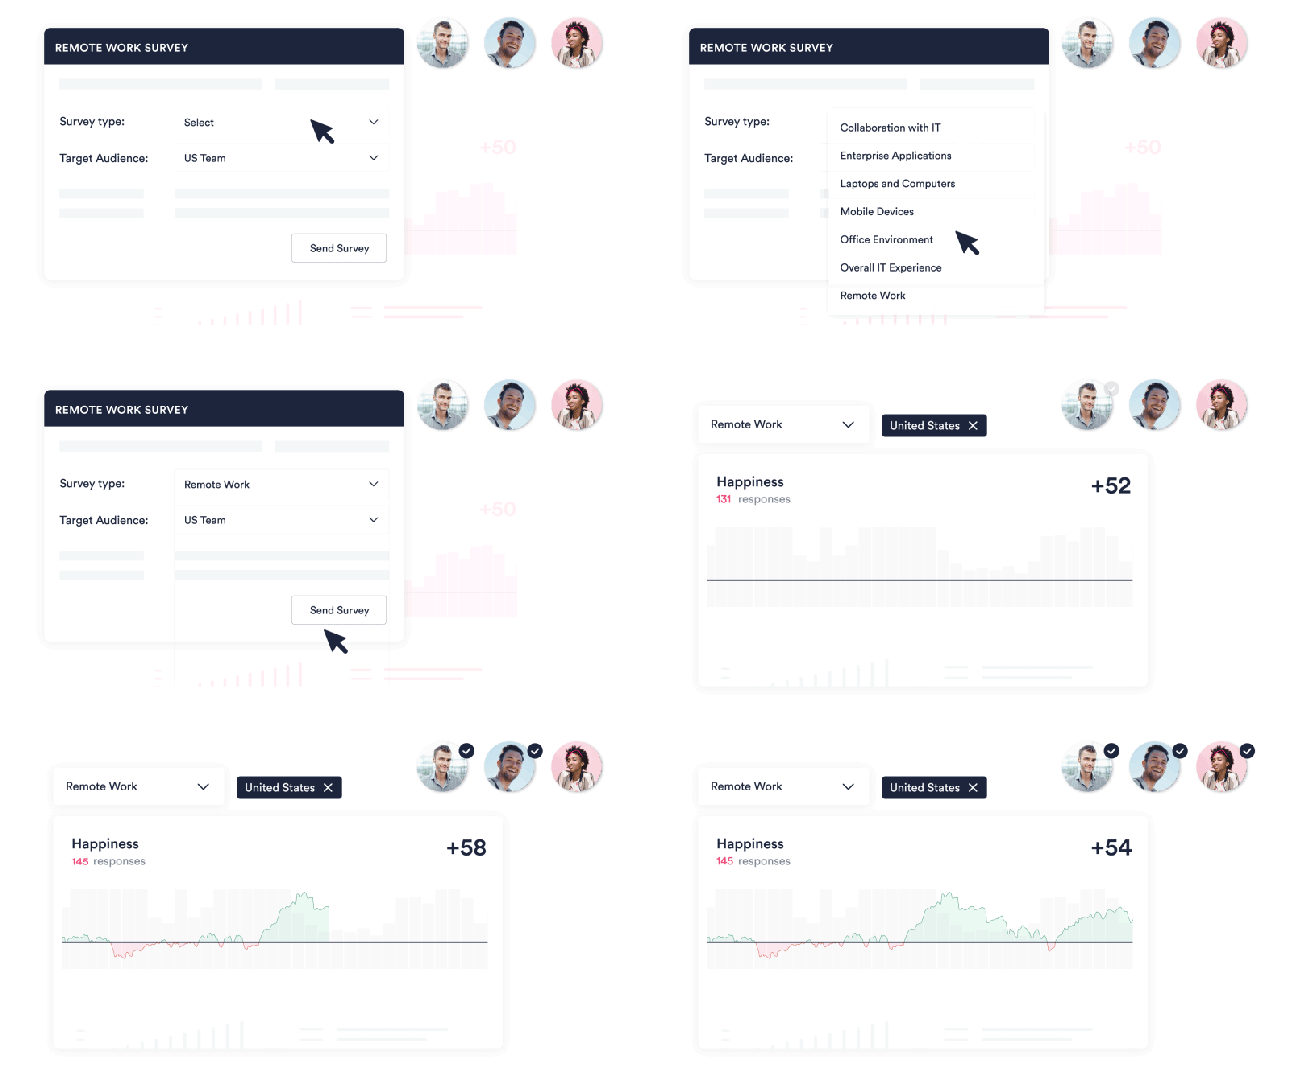
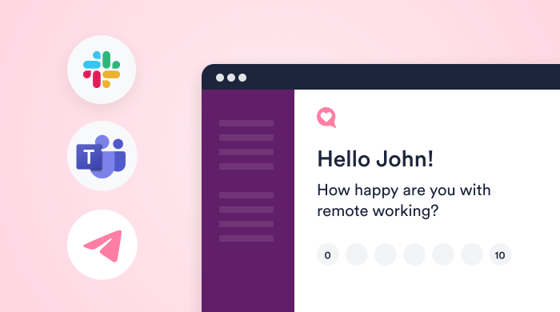
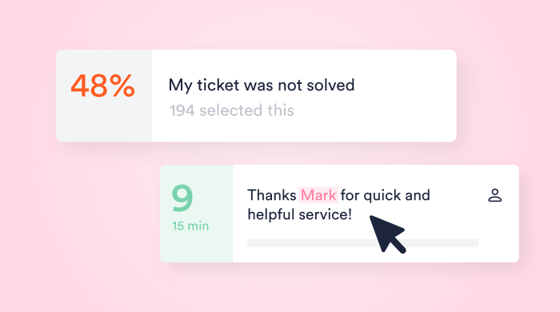
Start collecting experience data in days! Drive high response rates and get actionable data with research-backed and standardized surveys.
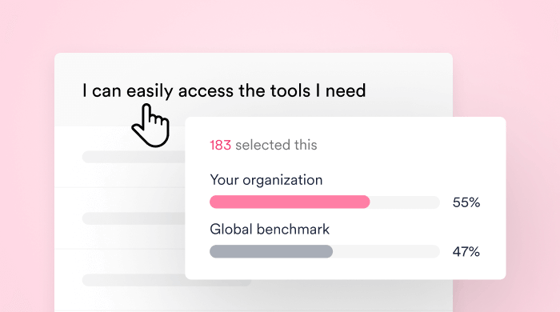
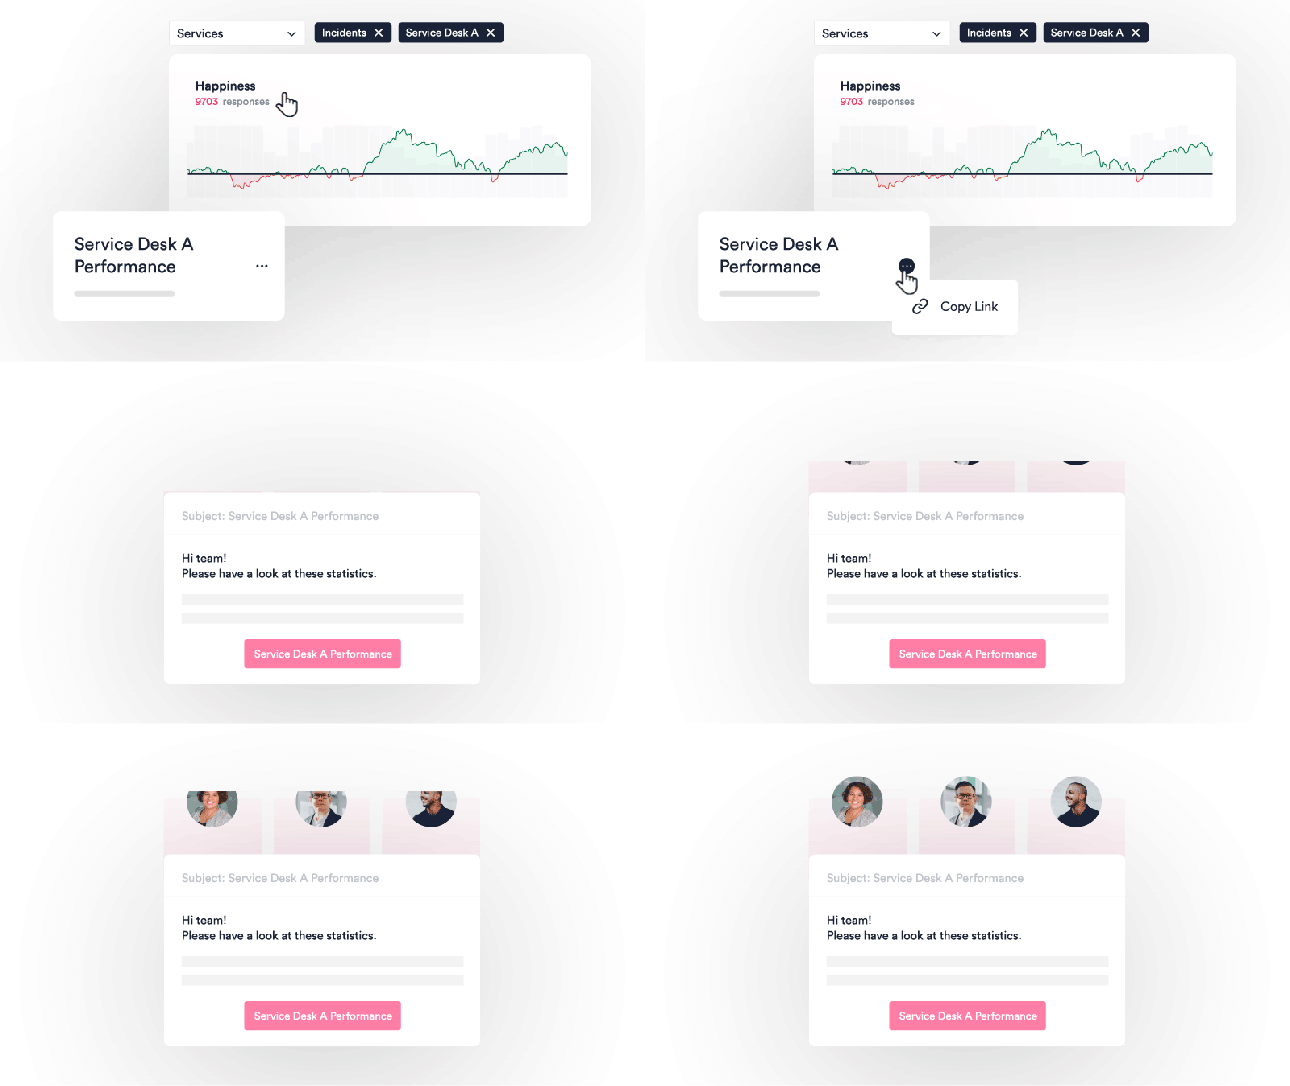
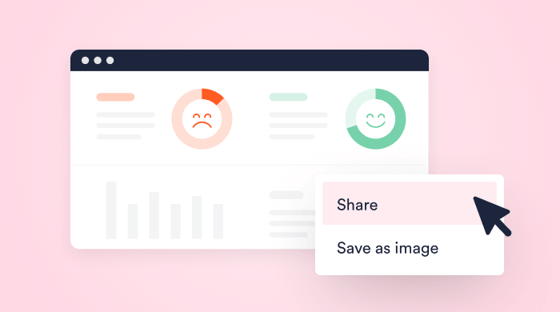
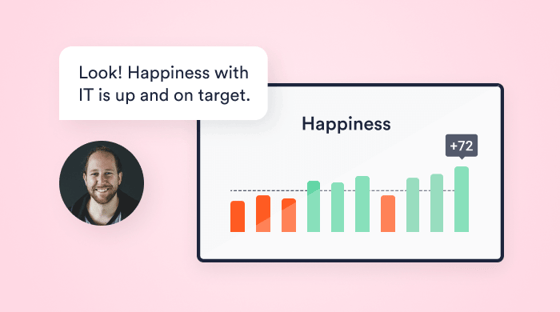
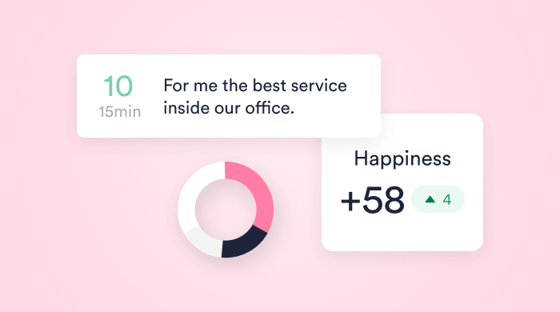
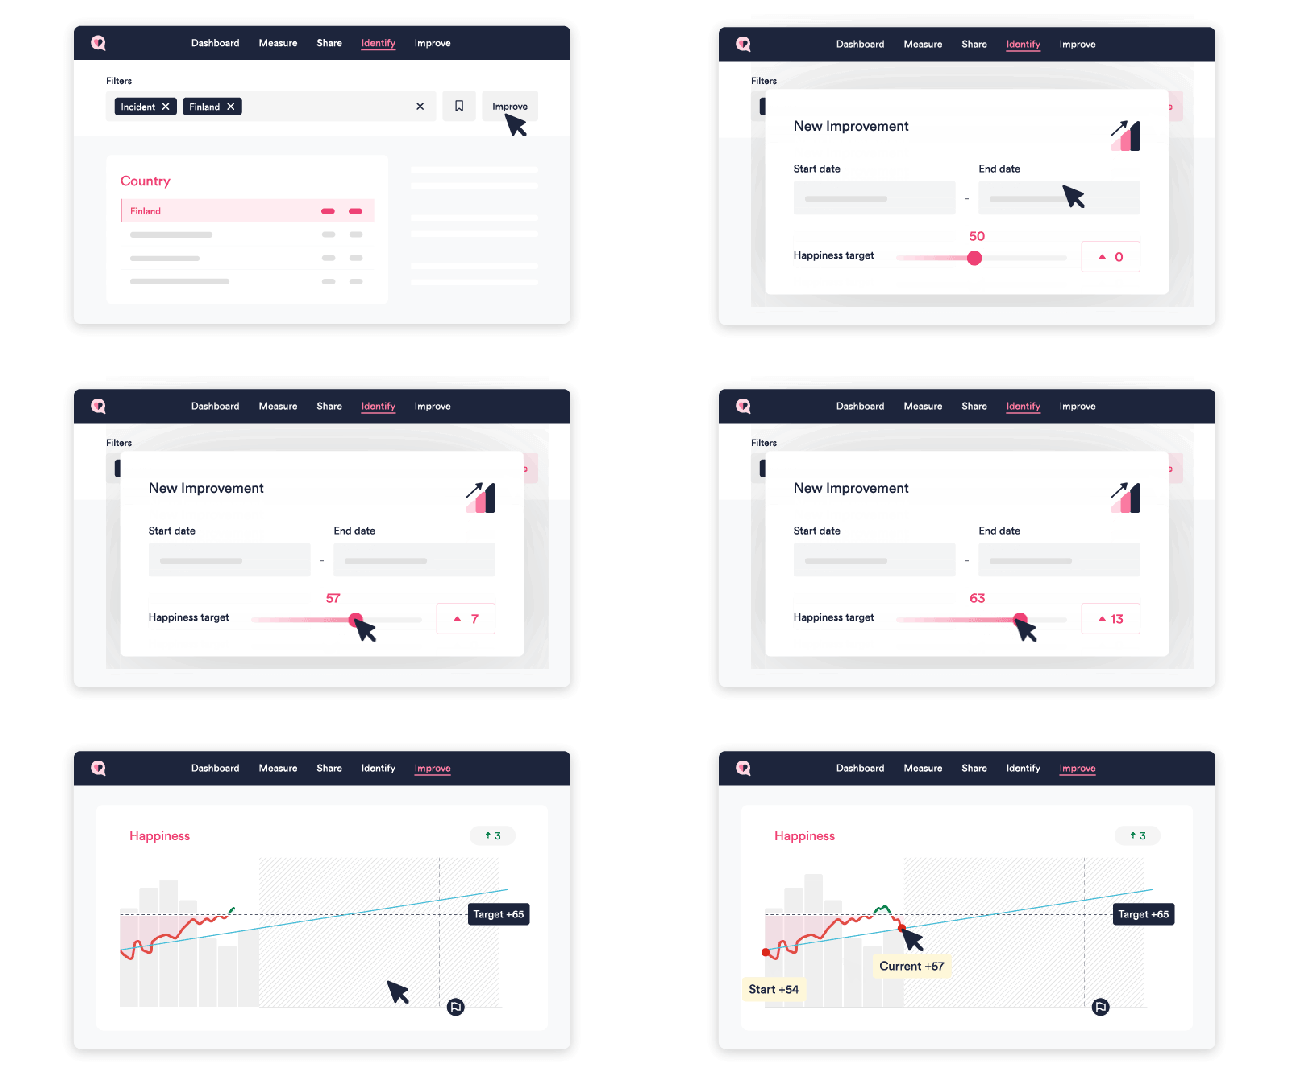
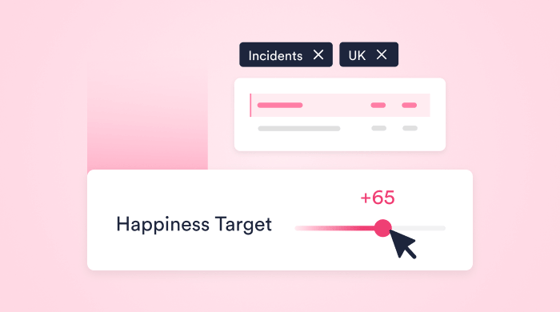
Drive continuous improvement with actionable data – no more gut feelings! Allocate resources to the right places to achieve business outcomes.
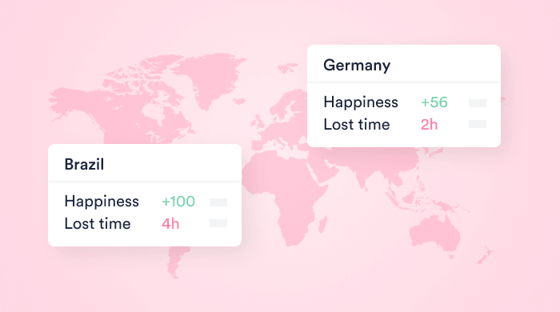
Get a real-time view into where people lose most of their productivity and quantify the cumulative productivity gains that IT's actions have brought.
