Spread the word about how people feel
Data isn’t meant to sit still. It’s meant to be shared and acted on.
From reports for specific meetings with the CIO and other stakeholders, to live screens in canteens and meeting rooms – share it!

From reports for specific meetings with the CIO and other stakeholders, to live screens in canteens and meeting rooms – share it!

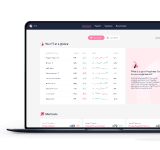
Create visually engaging, easy-to-understand reports in just seconds — no design skills needed. Show the state of IT at a glance, whether for the whole organization or a specific team.
Use our two north star metrics — Happiness and Lost Time — along with open feedback and trends to support improvement proposals and influence decisions that matter.


Ready to get started?