Analytics

We deliver data, you make decisions

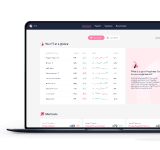
Real-time data presented in a clean format — designed to help you identify and pinpoint the problems your employees experience with IT.

Anyone can be an analyst-02

Anyone can be an analyst


Gathering the right data isn’t enough if you can’t interpret and analyze it. With the HappySignals platform, anyone can become an analyst — no specialized knowledge required.


Easy to use

You can get your first insights the minute you enter the platform.


See what matters to you

Create your own view with Focus Area for any hat you wear — be it service ownership or a specific department — and only see the data you care about.

Neg-Make sense of it all — fast-02

Make sense of it all — fast

Ditch the spreadsheets. Interactive views and built-in AI on our platform combine thousands of data points into clear visuals, revealing areas of low happiness or high lost time in seconds. See how it works in action! 


See the story behind the score

See the story behind the score

Don’t stop at the numbers. Experience Indicators and open text feedback reveal the "why" behind poor experiences. AI summarizes thousands of comments and auto-translates them, so you can uncover key issues at scale—no matter the language.


What happens next with the data we gather

Data is analyzed

Navigate data, identify trends, get valuable insights.


Ready to drive Experience Management in your organization?

Let's talk!


Book a 30-min meeting to discuss your challenges and how Experience Management can help.

Book a Demo
See how HappySignals Platform works

Watch Demo
HappySignals Platform

Ready to get started?

Contact Sales

Contact Sales