Eliminate Manual IT Surveys and Reporting

Is your time well spent on IT surveys and custom reports? HappySignals does those for you, so you can devote your time and expertise to improving IT for end-users instead.

usecase_hero_04

Make the best use of your work time

Stop spending hours on optimizing surveys and building reports about IT experience manually.

HappySignals includes research-backed out-of-the-box surveys for IT experience in ticket-based and proactive IT. Our platform combines experience data and operational data from your IT service management (ITSM) tool to provide a real-time view of experiences across all IT areas.  

By automating the time-consuming process of continuously collecting and processing experience data, you can let the HappySignals platform work for you, so you can use your time to improve end-user services. 


Key takeaways:

  • Save time by using HappySignals instead of manually optimizing IT experience surveys, and building reports
  • Get comparable and reliable experience data with HappySignals' standardized, research-backed surveys
  • Build trust and cooperation between stakeholders with a single real-time view of experiences across all of IT


What is in it for you?

Get a real-time view of your IT organization

Effortlessly drill down into the data to compare and contrast different regions, services, vendors, offices, and applications to understand where you can replicate success in areas that need improvement. 

Use the Benchmark data to look outside your organization and understand how your IT organization compares to our real-time Global IT Experience Benchmark results.


Effortless real-time reporting for all service areas

Simplify the challenging task of reporting on the impact of Experience-led initiatives across your organization. HappySignals' standardized surveys provide comparable experience data based on end-user Happiness and Productivity across all service areas, so you don't need to juggle conflicting metrics.

Our intuitive analytics platform makes real-time reporting easy, so you can focus on delivering an excellent experience for your internal end-users.

Focus on real work, don't waste time on manual reports

Using HappySignals as your real-time reporting platform eliminates the need the manual reports. The trust in the data will be higher when all levels of the organization see the same view of the IT Experience. For more specific needs, our intuitive drill-down analytics and 1-click sharing of custom report shortcuts makes catering to particular needs effortless.


Do you find reporting complicated?

Have you ever been asked, "How am I supposed to understand this data?". The complexity and disconnect of traditional IT metrics have led to manual reporting needs, where your time is spent on interpreting IT data for non-IT stakeholders, who may or may not trust the numbers. HappySignals provides a platform with a real-time view of how end-users experience IT services. Using HappySignals lets you focus on delivering a great experience and enables the platform to provide real-time transparency for all stakeholders.


usecase_survey

Get data everyone can trust

Creating surveys from scratch takes time and expertise. If not done well, your surveys will suffer from low response rates and not produce reliable data. 

HappySignals comes with standardized out-of-the-box surveys  designed and tested with end-users. Roll them out in minutes, drive high response rates, and get comparable and reliable experience data across all IT touchpoints!

usecase_identify_data

Easy real-time reporting for all stakeholders

Use intuitive filters and sorting options on the HappySignals platform to focus on the data that matters to you.

Report your selected data in real-time directly from the tool, or share links to custom data shortcuts with your colleagues and stakeholders.

usecase_sharedata

One platform, many users

With HappySignals, all your colleagues, partners, and stakeholders can have a shared view of end user experience on one platform.

Our intuitive platform can be easily used by either technical or non-technical users and comes at no extra cost for additional platform users.


usecase_livescreen

Live Screens make experience data visible

Display real-time experience data on digital signages around the office with HappySignals' Live Screen feature. Make experience a visible fixture and talking point amongst everyone.

Transparently sharing experience data with everyone can be a powerful way to build trust with internal end-users, colleagues, and partners.

usecase_Bitools

Use experience data in Business Intelligence tools 

Easily bring data from HappySignals into BI tools with our REST API if you wish to analyze experience data in context with existing sources of technical and operational data in your organization.

Find out more in our short and sweet API documentation.


use_cases_thumbnail_

One platform, many solutions

Discover other HappySignals solutions for common IT challenges, or see how our Experience Management Platform works.

See All Solutions

Check Out the Platform

Schedule a Meeting with our Expert


Eliminate Manual IT Surveys and Reporting


Interested in learning more about how to get rid of the manual work associated with IT surveys and reporting?
Schedule a meeting to discuss how to automate the tedious processes of manual IT surveys and reporting of end-user experience in your organization.

You'll learn:

  • Why it's important to collect and process experience data continuously
  • How HappySignals standardized & research-backed surveys works in practice
  • How HappySignals enables you to get a trustworthy real-time view of your IT organization 


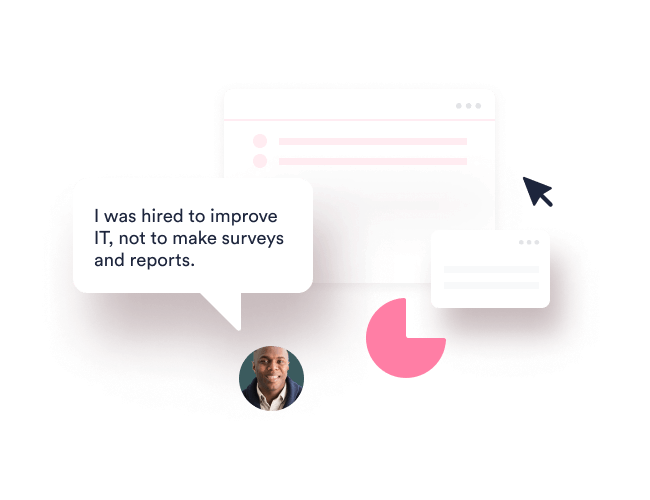
Book a session with our ITXM™ Lead, Sakari Kyrö, to learn more about how HappySignals helps you get rid of manual IT surveys and reporting.