
Why lost time is lost money
Your service desk dashboard is green, your CFO is calm, and somewhere across your organization, millions of dollars a year are quietly evaporating. Spoiler: it could be as much as €7,563,600. HappySignals is the Experience Intelligence platform that measures the human experience of IT and turns continuous employee feedback into the intelligence that helps you make better decisions and drive real business impact.

Since joining HappySignals, I've spent most of my time talking to IT leaders about how their support actually performs. And I've noticed something: nothing reframes a "yeah, we're doing fine" conversation faster than one number.
According to our Global IT Experience Benchmark 2026, employees report losing 3 hours and 18 minutes (3.30 hours) of productive time per IT incident.
And that number isn't holding steady. It's drifted up about 15 minutes over five years, from 3h 3min in 2021 to 3h 18min in 2025, the highest it's been in a five-year window.
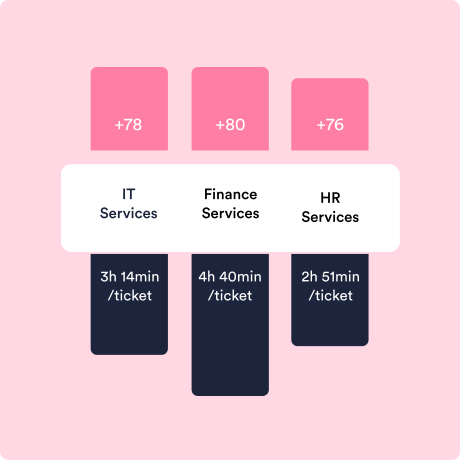
Meanwhile, happiness with IT support has barely budged (sitting between +76 and +80).
In practice, this means that the experience feels fine, but the bill just keeps growing. Classic watermelon: green on the outside, very red on the inside.
Now, let's do the math you can actually take upstairs.
Eurostat puts average hourly labour costs across the euro area at €38.2 (2025).
So, when we do the math, every incident costs, on average, €126 in lost time (3.30 × €38.2). The typical employee logs roughly one incident per month.
Feeling good about doing more with less at the service desk? I wouldn't be.
Real savings come from fixing the wider IT environment, not from squeezing the help desk. And cost-per-ticket, a metric many of us have treated as gospel is a flashlight pointed at one corner of a very dark room.
Let me show you why.
The number that's not in anyone's budget
Let's look at an example company called XYZ Company. They have 5,000 employees, so roughly 5,000 incidents a month.
Industry fully-burdened cost per ticket is about €21.50 (and way more for deskside support).
The service desk view looks like this:
5,000 tickets × €21.50 = €107,500/month, or €1.29M/year.
Probably manageable, right? The kind of line item that sails through a budget review.
But if we zoom out to the whole organization, to the people actually living these incidents, it gets ugly fast.
5,000 incidents × 3.30 hours = 16,500 hours lost every month
16,500 hours × €38.2 = €630,300/month, or €7,563,600/year.
That €7.6M isn't sitting in anyone's IT budget, but it's spread invisibly across every team in the company as lost productivity, and nobody's tracking where it goes (unless they're measuring lost time).
Benjamin Franklin said time is money. The 2026 version: lost time is lost money, and no amount of service desk cost-cutting will ever claw back what bad IT experiences drain out of the rest of the business.
When the benchmark dug into 1.5 million+ reasons people gave for a good or bad incident, only 6.6% had anything to do with whether the ticket got solved.
What actually moved the needle? Speed of support (29.2%), the agent's attitude (20.5%), and their skills (19.0%).
Speed is just lost time wearing a different outfit. Optimize for cheap closed tickets, and you can quietly inflate the one cost that dwarfs all the others.
One clarification before anyone calls this downtime: it isn't.
Downtime is when systems are flat-out unavailable, and revenue stops, like Facebook's 2021 outage that reportedly cost $60M+ (approximately €51.6M).
What we're talking about is quieter and arguably worse: nobody runs a root cause analysis when Chris can't get into Salesforce or when Rachel's laptop won't boot. The productivity just disappears, and so does the money. 💸
Where the money actually leaks
Only about 1 in 8 tickets (13.3%) gets bounced between two or more teams, but those are the tickets where lost time really, really racks up.
A first-time fix costs an employee around 2 hours and 7 minutes. A ticket passed across five teams is suddenly 10 hours and 35 minutes, and that's 8.5 extra hours gone, per ticket, while happiness nosedives from +83 to +42.
Every handoff stacks on the last.
Small slice of your volume, massive slice of the damage. And none of it shows up on a cost-per-ticket report. The good news is that this is the stuff experience data actually surfaces, so not all hope is lost.
How does a 1-hour fix cost 3 hours of someone's day?
Fair question that I get in nearly every conversation.
To illustrate this, think about the last time something broke at home.
You try to fix it yourself first. You Google it, maybe ask ChatGPT, you watch half a tutorial on YouTube. You dig out the manual you swore you'd never need. You try the thing again, just to be sure.
After a bunch of time troubleshooting, you finally call someone. While you wait, you start a different task, get halfway in, get interrupted when help arrives, then have to drag your brain back to the original thing afterward. The actual repair takes 20 minutes. Your afternoon? Gone.
Now, that's Rachel from work with the dead laptop. By the time they've checked the charger, the battery, the cable, skimmed three knowledge articles on their phone (because they know the service desk will ask), logged the ticket, switched to other work, and then refocused twice, the clock has eaten hours.
Refocusing isn't free: studies put it at 23 minutes or more after each interruption. At €38.2/hour, that's about €14.64 of pure "wait, where was I?" tax every single time.
Suddenly, 3 hours and 18 minutes doesn't sound dramatic at all.
So, what do you actually do about it?
Stop guessing and start measuring.
Then, you fix the things that actually move the number.
Experience data helps you:
- Focus on the right things
- Actually make the improvements people want and need
- Hit the level of happiness and productivity that employees are after
- Point your effort where it counts
If you genuinely want to control costs, look at them across the whole organization and act on what the data tells you.
That's where the €7.6M lives, and that's also where you get it back. Get moving in year one and you can expect to recover about 26% of it, roughly €2.0M back in the business's pocket.
This is the conversation I'd love to have with you. Take a look at the platform and let's talk!

One insight a month, in your inbox.
New articles, benchmark data, and customer stories. No fluff.