Productivity Measurement
Learn about HappySignals built-in Productivity Measurement features

This guide offers IT leaders, CIOs, and CFOs actionable insights to boost employee productivity. Prioritizing impactful IT improvements will benefit end-users by making them more productive.
Reading time: 25 minutes

This IT Leaders Guide to Employee Productivity is aimed at senior IT and business roles that make IT decisions that impact employee productivity. This includes IT leadership and other IT decision-makers such as CFOs. It can be considered part of the required management toolkit for moving employees from working harder to working smarter, with those responsible for IT provision – from IT decision makers to those who provide IT support – understanding what helps and hinders employees in their work. Such that employee productivity can be maximized through the prioritization of IT improvements in the right areas, i.e. what matters most to employees.
Table of Contents
While the term “employee productivity” can be defined simply – for example, workforce productivity (the amount of goods and services a group of workers produces in a given amount of time) attributed at an individual level – the influencing factors are more complex. This is because, as shown by the list below, not only are the influencing factors varied, but they also affect each other. For example, the quality of management and leadership experiences can impact employee motivation and engagement. Or an employee’s skill level can affect how they can progress their workload.
Simply addressing one or two of these factors isn’t enough. Instead, there needs to be balance across all of the factors such that one or more unaddressed factors don’t adversely affect employee productivity.
For IT service providers, there are two levels of employee productivity to understand and address. First, the productivity of IT staff. Second, that of the employees or end-users they serve. Importantly, these aren’t mutually exclusive, with the proactivity of IT staff ultimately affecting the productivity of employees (or end-users).
When IT workers can focus on end-users, they can undertake work that’s considered important. Rather than just being “busy” and focused on IT processes and technology, an employee-centric focus means they can rise above working to please IT leadership and instead improve IT service delivery and support for the thousands of employees in the company.
Employee productivity is influenced by an employee’s:
Most businesses need greater employee productivity, which is caused by various factors, including maximizing competitive advantage. Therefore, IT service providers need to be interested in employee productivity, which applies to both IT employees and employees using IT services. As just mentioned, when IT workers can focus on end-users, they can undertake work that’s considered important. However, this is just one side of the employee-productivity coin.
The other is the rise of the importance of employee experience in unearthing the issues caused by what the IT industry has termed the “watermelon effect” and the associated frustration with IT leadership. Given that few IT service providers have unlimited resources for improvement, the experience data is also needed for initiative prioritization and to allocate IT resources efficiently. Only the people with the experience data can tell what matters most to employees and their productivity.
The “watermelon effect” happens because of the unsuitability of traditional IT metrics and service level agreement (SLA) targets. The agreed-upon targets are hit, but there are still issues (and employees aren’t happy with the IT services they receive). For example, IT teams might be reporting 99.8% service availability. However, employees are still frustrated by the productivity losses they encounter because of IT issues. The business view is that IT is not adequately enabling business operations and outcomes. At the same time, IT personnel might state they can’t do more when they’re wasting time on things that don’t solve the watermelon effect and the bigger picture of employee experience and productivity.
With experience data, IT service providers can find meaningful problems to solve. The technical data might show that something is wrong, but it’s people data that confirms if it’s meaningful to solve.

Many parts of an organization are potentially unknowingly invested in experience data and the resulting improvements. Human Resources (HR) senior leadership might want IT to help improve employee experiences throughout the organization, and the CFO might call for IT to drive employee productivity improvements and IT cost reductions through technology to meet their financially focused objectives. While the HR organization is likely not focused on improving employee productivity, it’s important to remember the role that productivity plays in enhancing the employee experience – with
Forrester stating that “…the most important factor for employee experience is being able to make progress every day toward the work that they believe is most important.”
Employee experiences and employee productivity are inextricably linked. Hence, IT employee experience data can be used not only to identify the critical IT service delivery and support issues that make employees less productive but also to improve employee experiences so that employees are happier in their work. This facilitates their motivation and engagement and increases employee retention – removing significant business costs and productivity inhibitors.
The HappySignals IT Experience Benchmark data, captured from customers’ employees, shows that the average lost work time per ticket currently amounts to around three hours per ticket. However, the worst-performing organizations lose double this. If you consider a 10,000-employee organization with 60,000 tickets per annum, this is a significant level of employee lost productivity. Plus, it’s a great opportunity to drive IT improvements that positively affect business operations and outcomes (and the business’s view of the IT service provider’s value).
The experience data also shows that happiness correlates with increased productivity, validating the Forrester quote on employee experience and productivity. Hence, as an IT service provider identifies and addresses where its IT service delivery and support issues are, prioritizing what matters most to employees, improving both employee happiness and productivity, which, in turn, translates to improved business value.
While your IT service provider might closely measure the productivity of IT staff, it will have little or no insight into the productivity of business employees and the impact technology has on this. The unfortunate business impact of this is that:
In the same vein as “watermelon” SLAs unfortunately hiding the truth of the end-user experience, IT service providers can be blind to how end-users are losing time because of IT service delivery and support issues. They can also invest in improvements that, while intended to improve employee productivity, either don’t or hinder employees more than they help. The measurement of lost time is a great proxy for employee productivity and a platform for data-informed improvement.
The creation of an IT self-service portal is a great example of this. While intended to offer “better, faster, cheaper” IT support to end-users, HappySignals IT Experience Benchmark data has consistently shown IT self-service portals to lose end-users more time (and productivity) with incidents than simply emailing the IT service desk. End-users are also least happy with it as an IT support channel for incidents (versus telephone, email, chat, and walk-up). So, while implemented with the best intentions, the IT service provider might benefit from IT self-service, but the business likely doesn’t (although the portal performs well for some of our customers if designed with employees).
By asking openly from end-users where they lose time IT gets priceless information about the business criticality of different services and assets. Reducing lost time can then be reported as gained productivity, without leading end-users to report on "soft gains".
IT infrastructure monitoring tools can measure the availability and performance of IT services. They can also do so “from the end-user perspective.” However, this is still a technology-based view of the impact of IT issues on employee productivity.
The emerging best practice is for IT to ask employees where they lose time. This not only provides a quantifiable number to work with but also gives an understanding of what’s critical to employees. Importantly, ticket resolution times don’t reflect the frustration and time an employee loses while first trying to solve their issue by themselves or, even worse, with their colleagues, leading to even more wasted effort.
It’s also important to appreciate the delta between what an IT issue costs IT to fix and the business impact on employee lost productivity. IT industry authority Roy Atkinson covers this in a “Measurement, Management and Money” webinar. Two key points are that:
For the former, the popular IT service desk metric of “fully burdened cost per ticket” is only the IT cost of handling a ticket. The business cost of an employee, or multiple employees and business operations, being unable to work can be significantly more. In the webinar, Roy shares an example where the IT cost of handling incidents is close to $500,000 annually. However, the business cost of the same incidents is approximately $3,500,000 per annum based on lost productivity and an average employee cost (rather than based on billable time rates and lost revenues). This means the IT service provider only sees and reports one-eighth of the total business costs of IT incidents.
Knowing about this disparity and the true figures for your organization better positions IT about the real impact of employee lost productivity, whether caused by IT support interactions (as per Roy’s example) or other aspects of IT services that cause employees to lose valuable time, including on a daily basis.
The image below shows where these productivity-affecting issues lie, with the IT service desk – called Services (ticket-based services) – far ahead of other IT services, including Laptops and Computers, Enterprise Applications, and Mobile Devices.
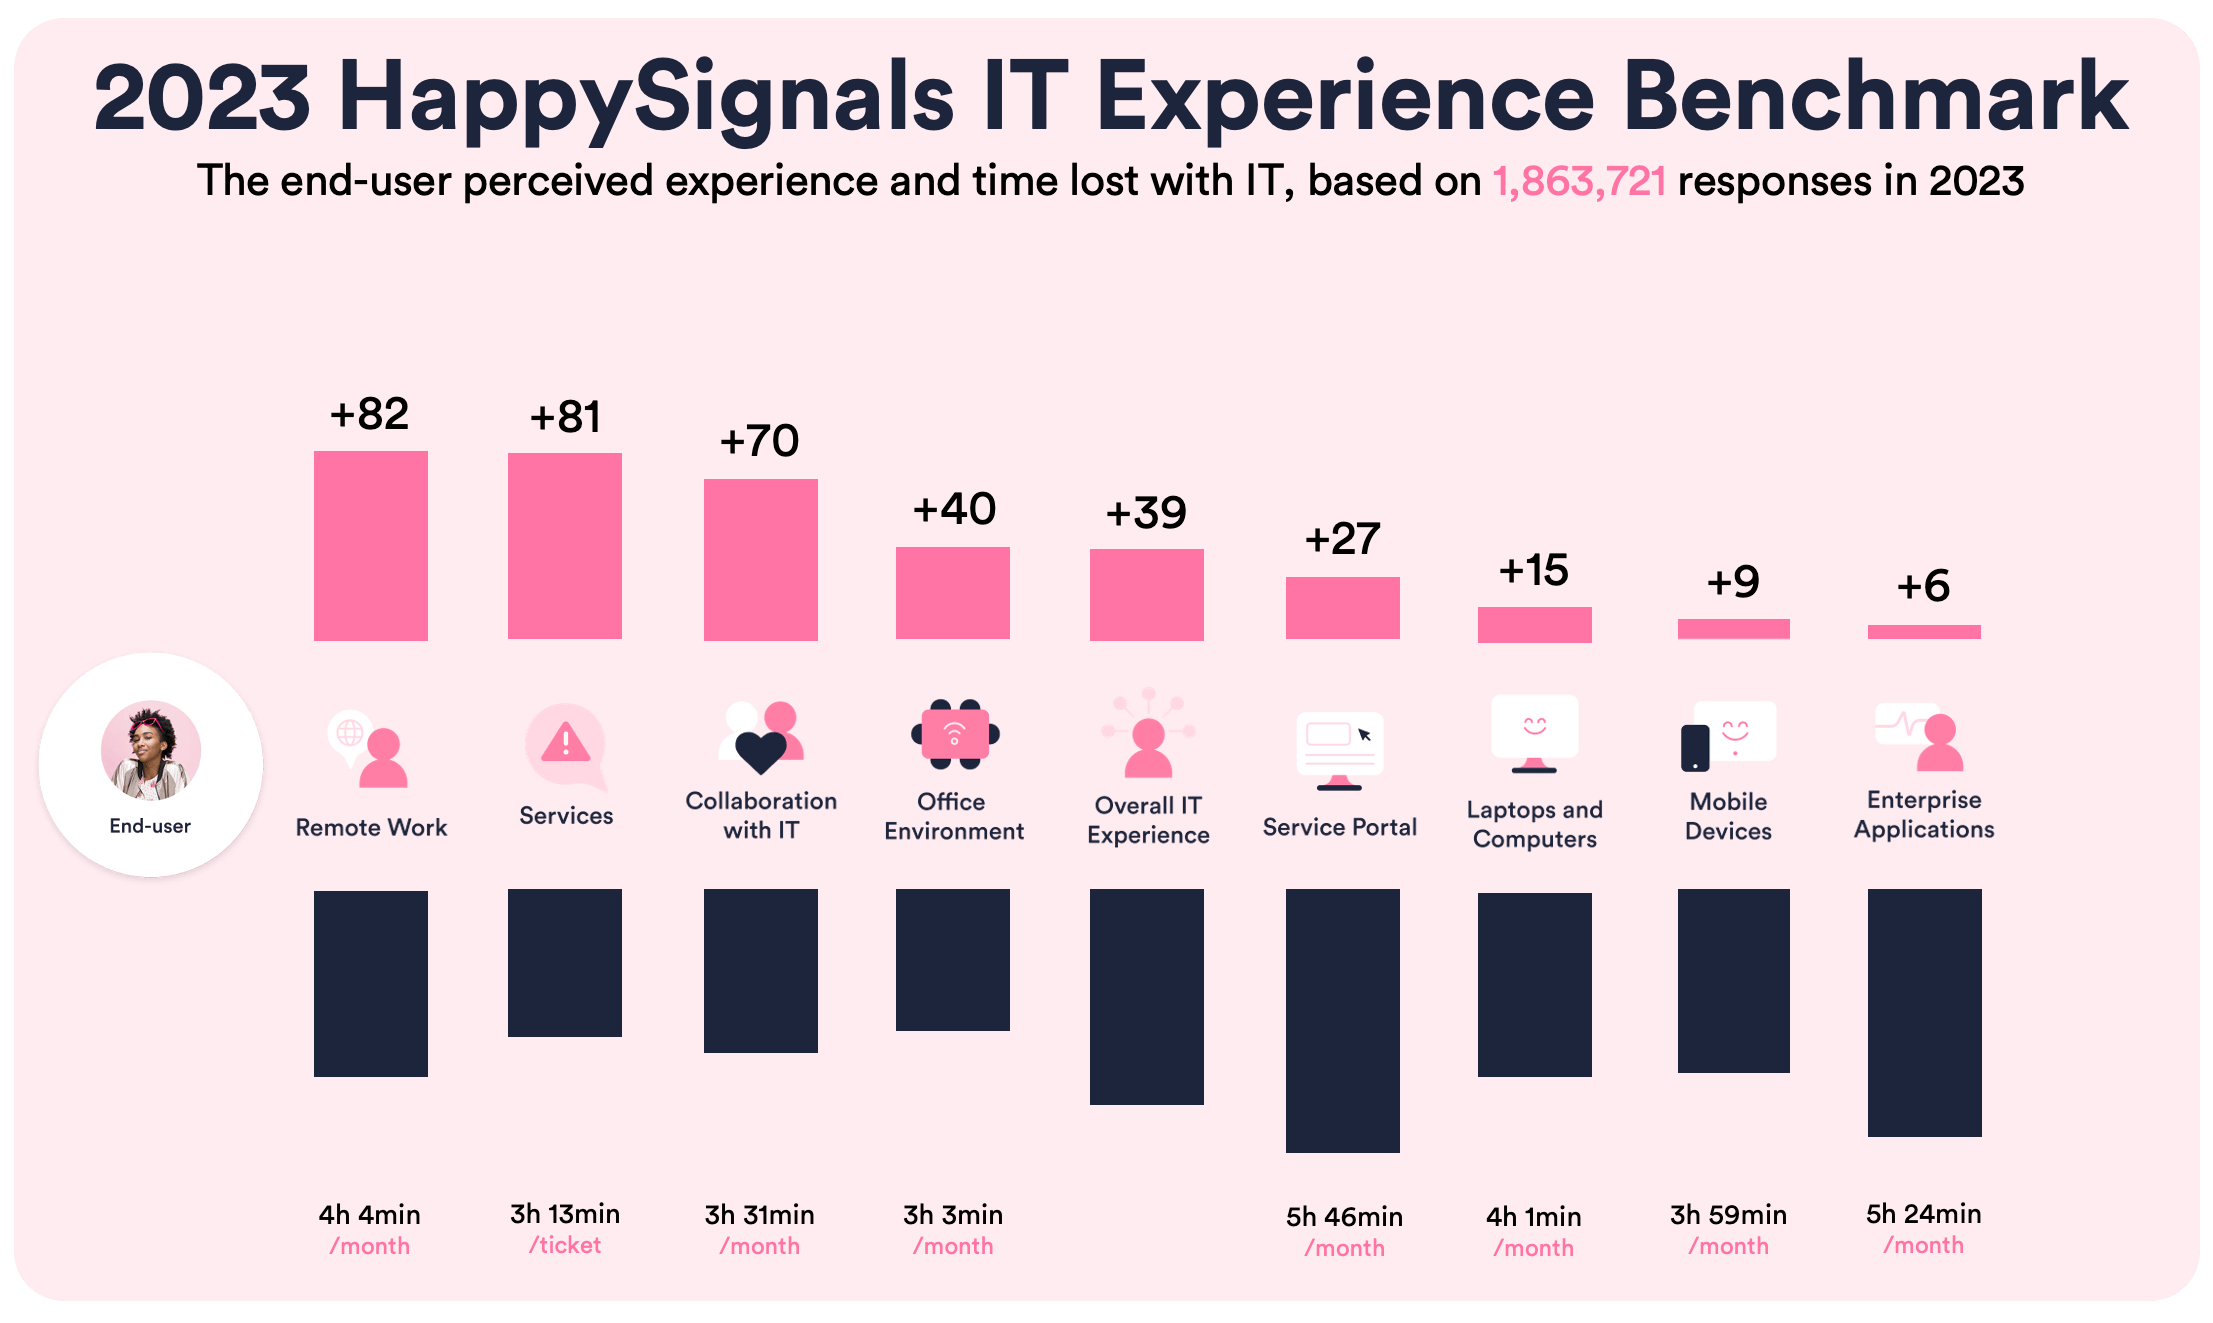
With this level of insight, IT service providers can collaborate with business decision-makers and the CFO to change how IT operations and improvement spending are prioritized – with budget decisions made based on company-level efficiency, not IT efficiency.
A 2023 HappySignals customer survey found the key benefits of IT experience management to be:
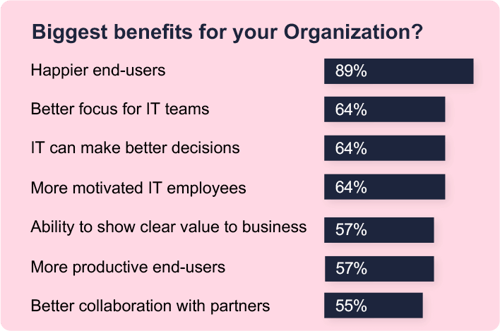
These generic benefits can be broken out into more detailed use case benefits. For example, making decisions that save money or ensure automation and artificial intelligence (AI) investments are made in the most appropriate places. The latter positively affects IT staff and end-user productivity, as does more motivated IT employees. Ultimately, most benefits can be linked to improving end-user productivity in addition to the 57% of survey respondents who saw their experience data as benefitting end-user productivity.
Our work with customers has identified IT experience layers for decision-making. For example:
So, for example, you might be surprised to learn that 80% of employees lost productivity comes from only 13% of tickets. However, the impact of this 13% is likely hidden for most organizations, and without this valuable insight, the related issues can’t be understood and addressed. There are many possible reasons for these high-productivity-loss tickets, including:
When the ticket SLA target is breached, the IT support focus moves to the tickets that are still within the target. So, the SLA target drives IT support behavior.
Multiple reassignments between resolution groups, which add to the resolution delay. Remember that while the SLA clock is potentially paused, the loss of productivity doesn’t stop for employees.
Communication “breakdowns,” for example, when more information is requested from an end-user and the end-user misses the request in their inbox. They will perceive the eventual taken as excessive, possibly after chasing progress.
However, no matter the root cause(s), the situations are significant causes of end-user lost productivity and unhappiness with IT. Importantly, both issues are likely hidden by traditional IT metrics.
Hopefully, another eye-opening insight from the experience data already shared above is the low scoring of Laptops and Computers (+15), Enterprise Applications (+9), and Mobile Devices (+5) versus the Overall IT Experience score of +39 and all the other IT touchpoints that exceed this, including the IT service portal. The aggregated experience data shows that these IT services often have serious issues that cause poor end-user experiences and lost productivity. The key question is whether your organization has similar situations because traditional IT performance measures will likely not identify them. The result is that some of your IT services are potentially hindering employee productivity rather than helping it.
 80% of the total lost time comes from 13% of tickets, how do you know which tickets? Learn more about HappySignals Productivity Measurement features
Experience-led productivity improvements can happen across the IT service delivery and support landscape. For example:
Whether the experience-led productivity improvement relates to IT services or IT support, there’s an important connection – the experience data facilitates better decision-making related to IT’s focus, including where best to invest in improvements. This can include improving support capabilities, projects, or the IT-service status quo.
For example, our customers know that the Laptops and Computers service often provides negative employee IT experiences and lost productivity. They can thus focus on improving their score during a technology refresh program, using experience data to understand what employees think about their current device, identifying what’s working well or causing frustration and lost time. This insight not only leads to better-fitting IT equipment but the refresh program can also be scheduled to address the equipment causing the most issues first.
Multiple customers have managed the managed service provider (MSP) change process with experience data. After the change (from insourced IT to an MSP or from one MSP to another), experience scores always drop, but experience data helps quickly correct the situation.
Low lost productivity levels can also be used to drive improvement. For example, services where people are super happy and don’t lose time are perfect for automation and freeing up IT worker time for high-value-add activities. For instance, password resets could be automated instead of being handled manually, just like people use in their consumer lives.
Another customer example is using the Office Environment and Remote Working experience data to better understand the employee impact of working in both scenarios. The data and associated insights identify where employees are most productive and where they are losing time due to poor IT or issues controlled by other business foundations. This again enables IT to focus on what matters most, addressing the areas causing the most significant employee issues. Different business functions might need to be involved – for example, Facilities or Finance providing the means for better remote working. Or the CFO might use the experience data to drive a business case to reduce office spending and fund increased remote working capabilities.
Finally, a common customer improvement use case is leveraging experience data to drive automation and AI adoption. Investing where the technology will benefit employees and business operations and outcomes the most and avoiding the temptation to invest it where the IT service provider thinks it’s needed.
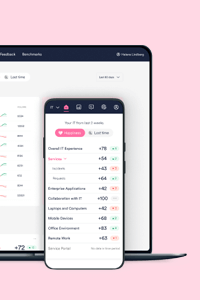
A continuous feed of experience data provides a real-time view of where end-users perceive they lose most time and productivity. By making the productivity data visible, IT service providers can highlight problem areas to all stakeholders, identify areas for improvement, and make data-driven decisions.
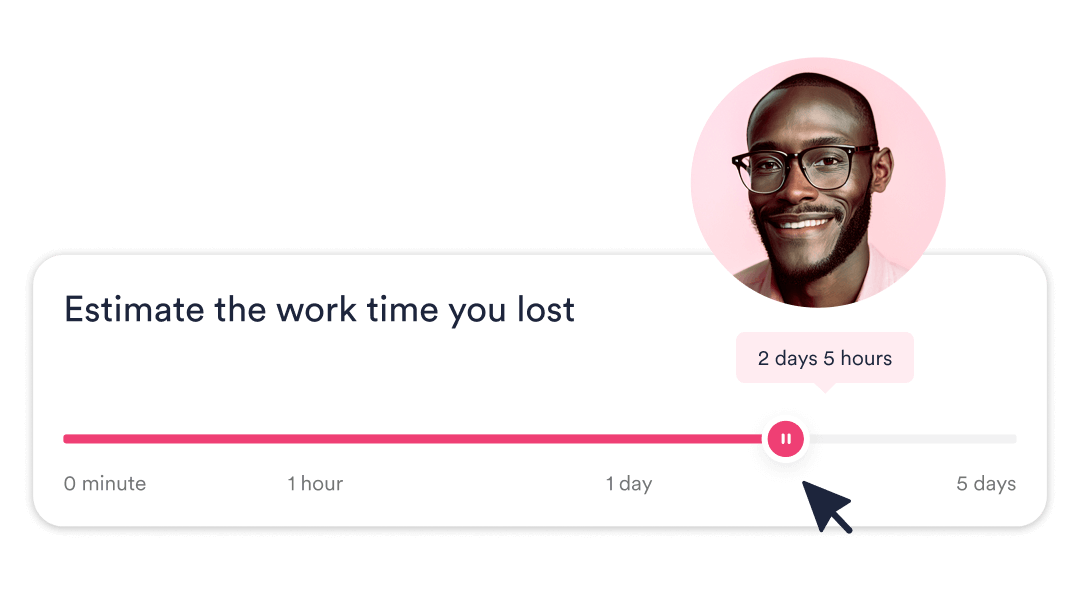
The HappySignals Experience Management Platform recognizes that experience data is all about people, with the collected lost-time data based on how people perceive their productivity loss. End-users are asked how much time they lost, not just in the process but from end to end. This is achieved through ready-made surveys and delivery methods.
Productivity gains are measured daily to highlight the impact of improvement efforts. The continuous measurement identifies where end-users are losing time and productivity, exposing the “watermelon effect” of traditional IT metrics. The collected experience data and insights allow IT service providers to focus on “what matters most” and prioritize their improvement efforts.
Access to the source data for analysis means that IT service providers can learn which business units lose productivity in which services and report on the real productivity gains made as a measure of business value. Importantly, while perceived lost time is measured, it’s the productivity gains that are reported.

Learn more about HappySignals Productivity Measurement features
Experience-based insight allows IT service providers to focus their improvement efforts on “what matters most.” If your organization wants to leverage experience data to improve IT service delivery and support for better end-user productivity (and the business operations and outcomes improvements that result), then the following practical guidance will help:
This Employee Productivity Improvement Guide provides insights into what influences employee productivity and the need for IT service providers to focus their improvements on “what matters most.” Plus, the link between employee experience and employee productivity, and the importance of measuring the people perspective, with this “human” experience data highlighting the truth about employee lost productivity.
The guide also offers examples of experience-led productivity improvements and guidance on:
The bottom line is that, with experience data (and the resulting improvements), IT service providers can be seen as enabling business operations and outcomes with better ways to demonstrate the value of their IT service delivery and support capabilities.
If you want to learn more about using experience data to improve employee productivity, learn more about HappySignals Productivity Measurement features.