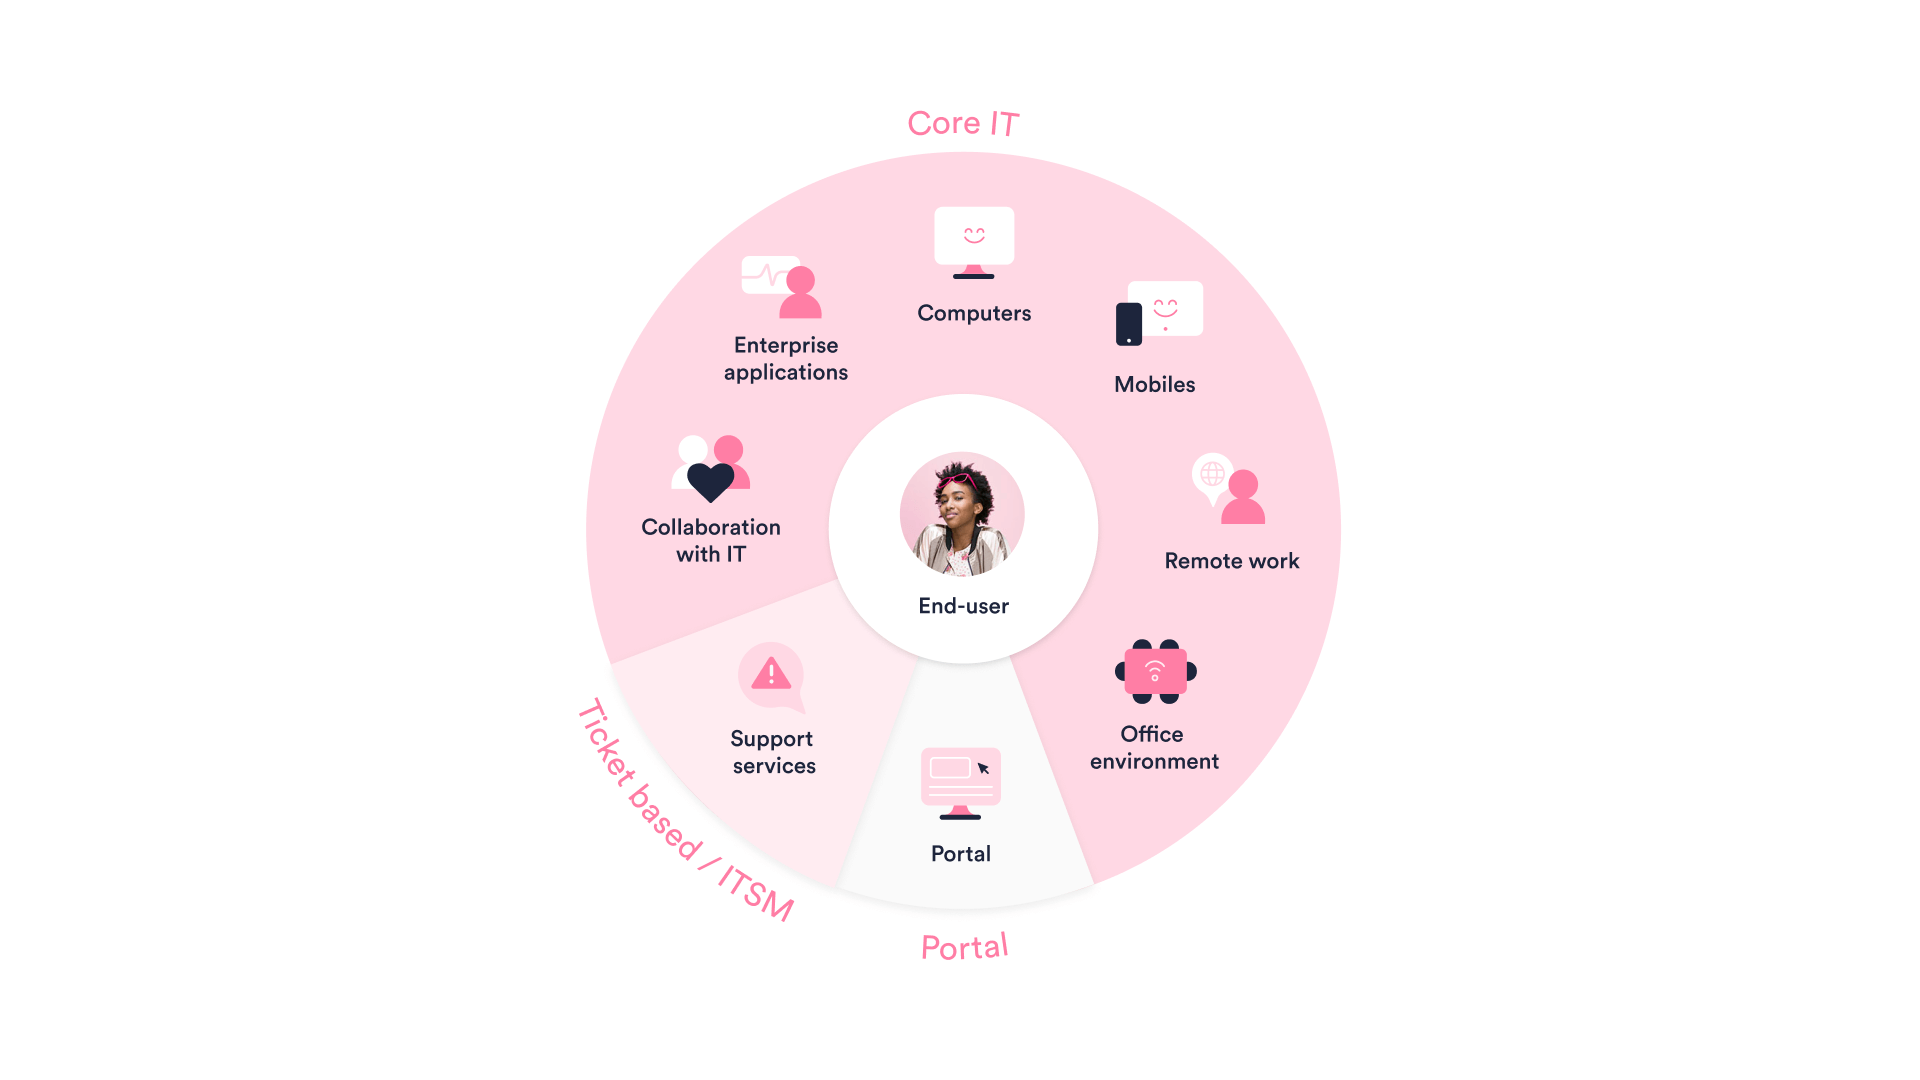
Make Experience a shared goal for IT
How do you measure IT performance in today’s complex IT environment?
Make Experience the common goal in your IT organization, and give everyone the tools to understand and improve end-user happiness and productivity.

July 30, 2021
Enterprises today have increasingly complex IT environments with different touchpoints and end-users in different countries, departments, or served by different outsourced vendors.
How do you measure how IT is doing across this multi-faceted environment?
Measuring too much or too little?
Chances are, your IT is either measuring too much or too little. From talking to different CIOs, I learnt that IT organizations may be measuring each of these different areas with different metrics, such as how the network is working, how quickly support services are answering tickets, etc.
With so many areas of measurements, it becomes incredibly complicated to really understand how IT is doing and what areas need improving. More importantly, it is difficult to establish common targets between your internal IT team and external partners, when different areas are measured differently.
On the other hand, some IT organizations risk oversimplifying things by only having one overall metric, such as CSAT. This is also insufficient, for it doesn’t differentiate between IT areas that are performing better or worse and hence, doesn’t tell you much about what you should focus improvement efforts on.
Make Experience a common focus for everyone in IT
So how should IT be measured and improved? We believe in making Experience the common focus for your entire IT organization.
But what does it mean to measure Experience?
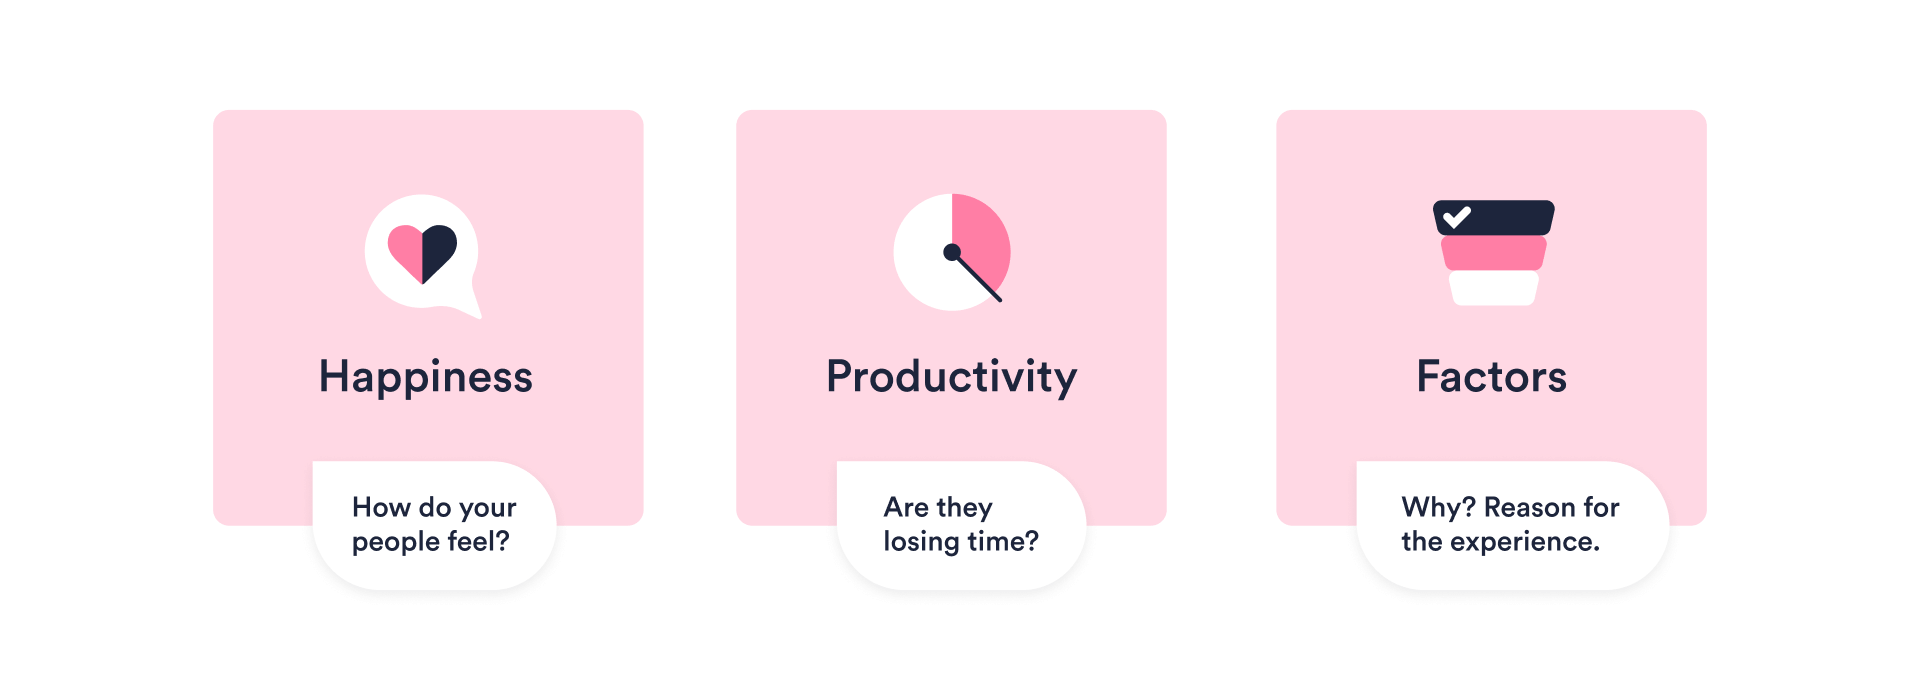
At HappySignals, we break it down into just three simple metrics. Focus on end-user Happiness, understand its impact on Productivity, and diagnose specific Factors that influence end-user experiences.
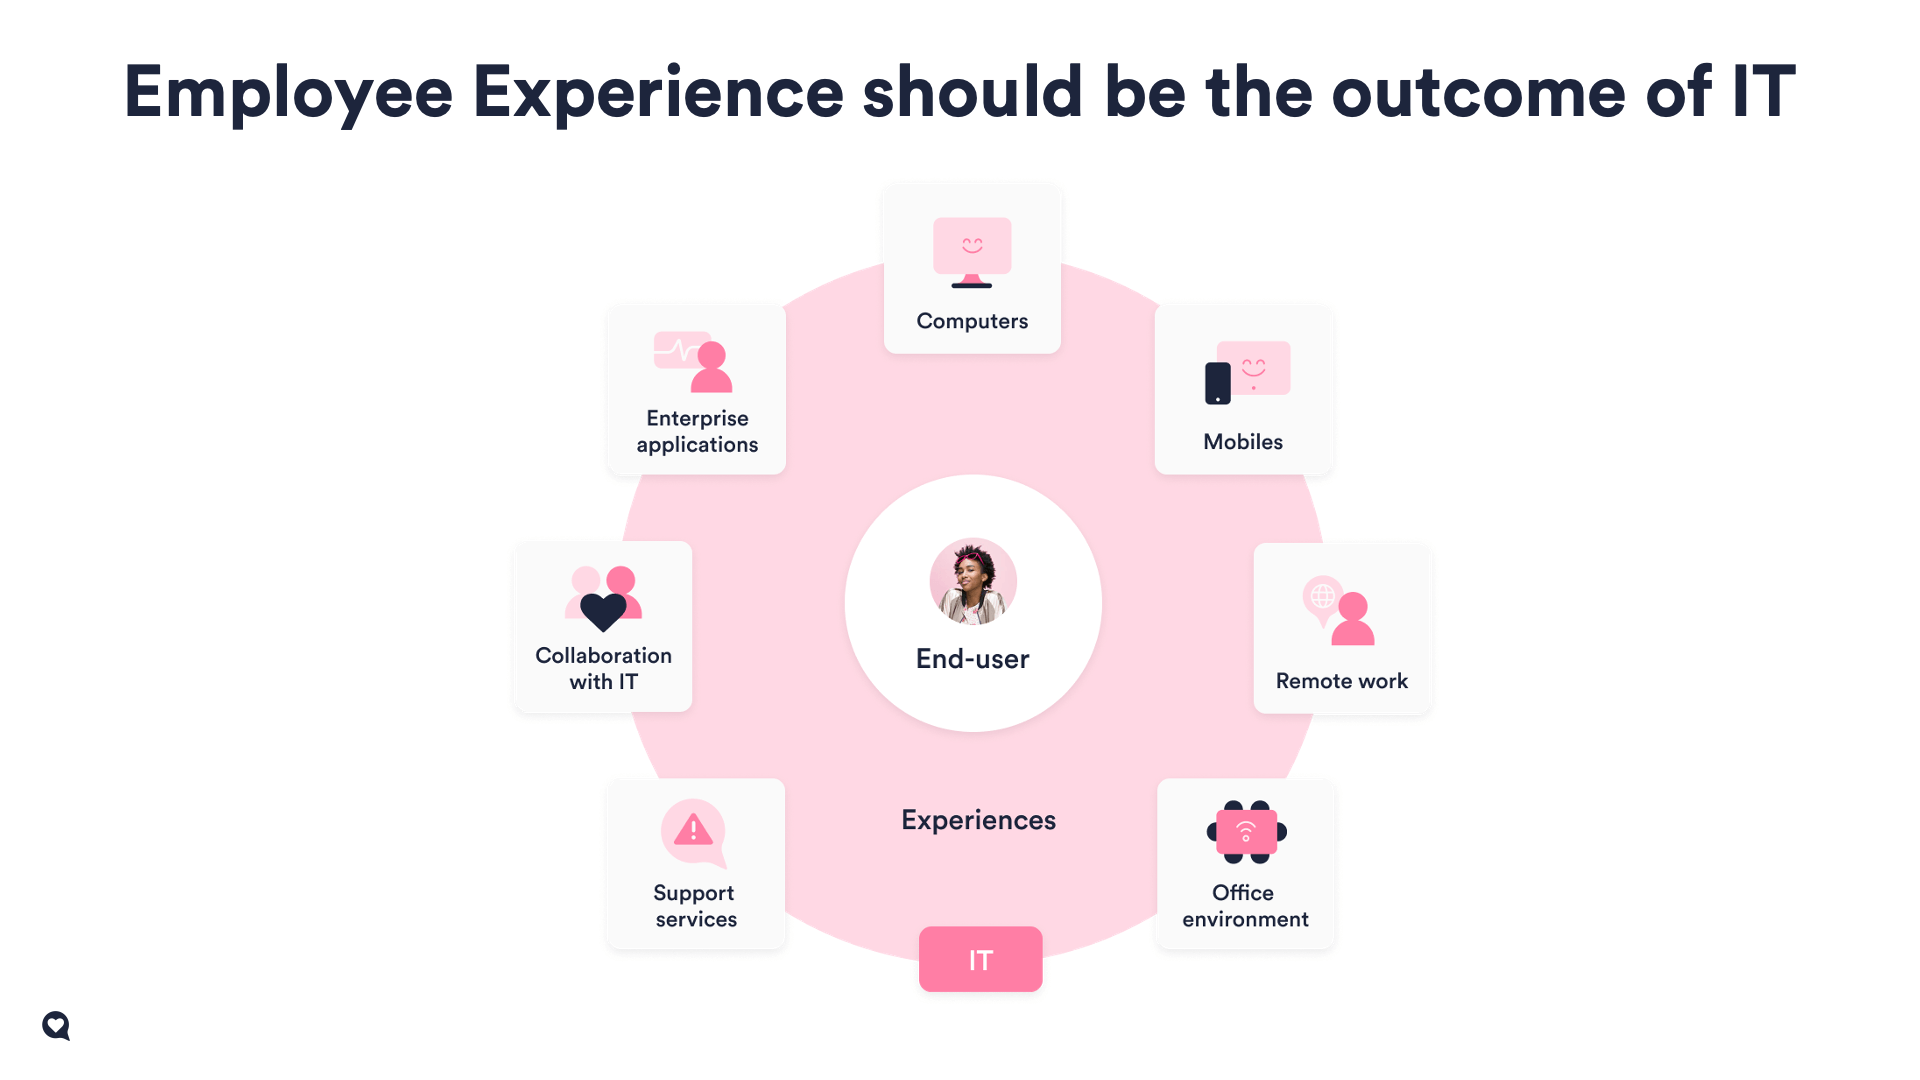
By establishing Experience as the common metric and target, only then can you make an outstanding Employee Experience the outcome of your IT Services.
Our customer Ahlstrom Munksjö is a great example of using Experience Data to establish alignment within their IT organization and increase end-user happiness.
As Dr. Ozan Acar, Head of IT Delivery and Partner Management at Ahlstrom-Munksjö, shares on this week’s Happy in 15 episode, HappySignals Experience Data is now used as the key source of feedback for all their IT management team members. In operational management meetings, they no longer just look at SLAs, but also at end-user happiness in different service areas.
“HappySignals data is currently one of our key data for all IT management team members. They all have access and can see, in a multi-dimensional way, the status for all services and locations. In operational management meetings that each service owner is having, they are also looking at the NPS (Happiness) for each service area, not just the SLAs.” (Dr. Ozan Acar, Ahlstrom-Munksjö)
Especially for organizations like Ahlstrom-Munksjö, which have a lean internal IT department but work with outsourced vendors, aligning the external and internal is often difficult. Making HappySignals NPS a key metric for service delivery has enabled Ahlstrom-Munksjö to establish more useful targets for their external vendors, and even agree on rewards for exceeding those targets.
Watch the full interview with Dr. Ozan Acar to find out more about the impact that focusing on Experience has had on ITSM in Ahlstrom-Munksjö.
No matter your role in IT, Experience is a more motivating goal
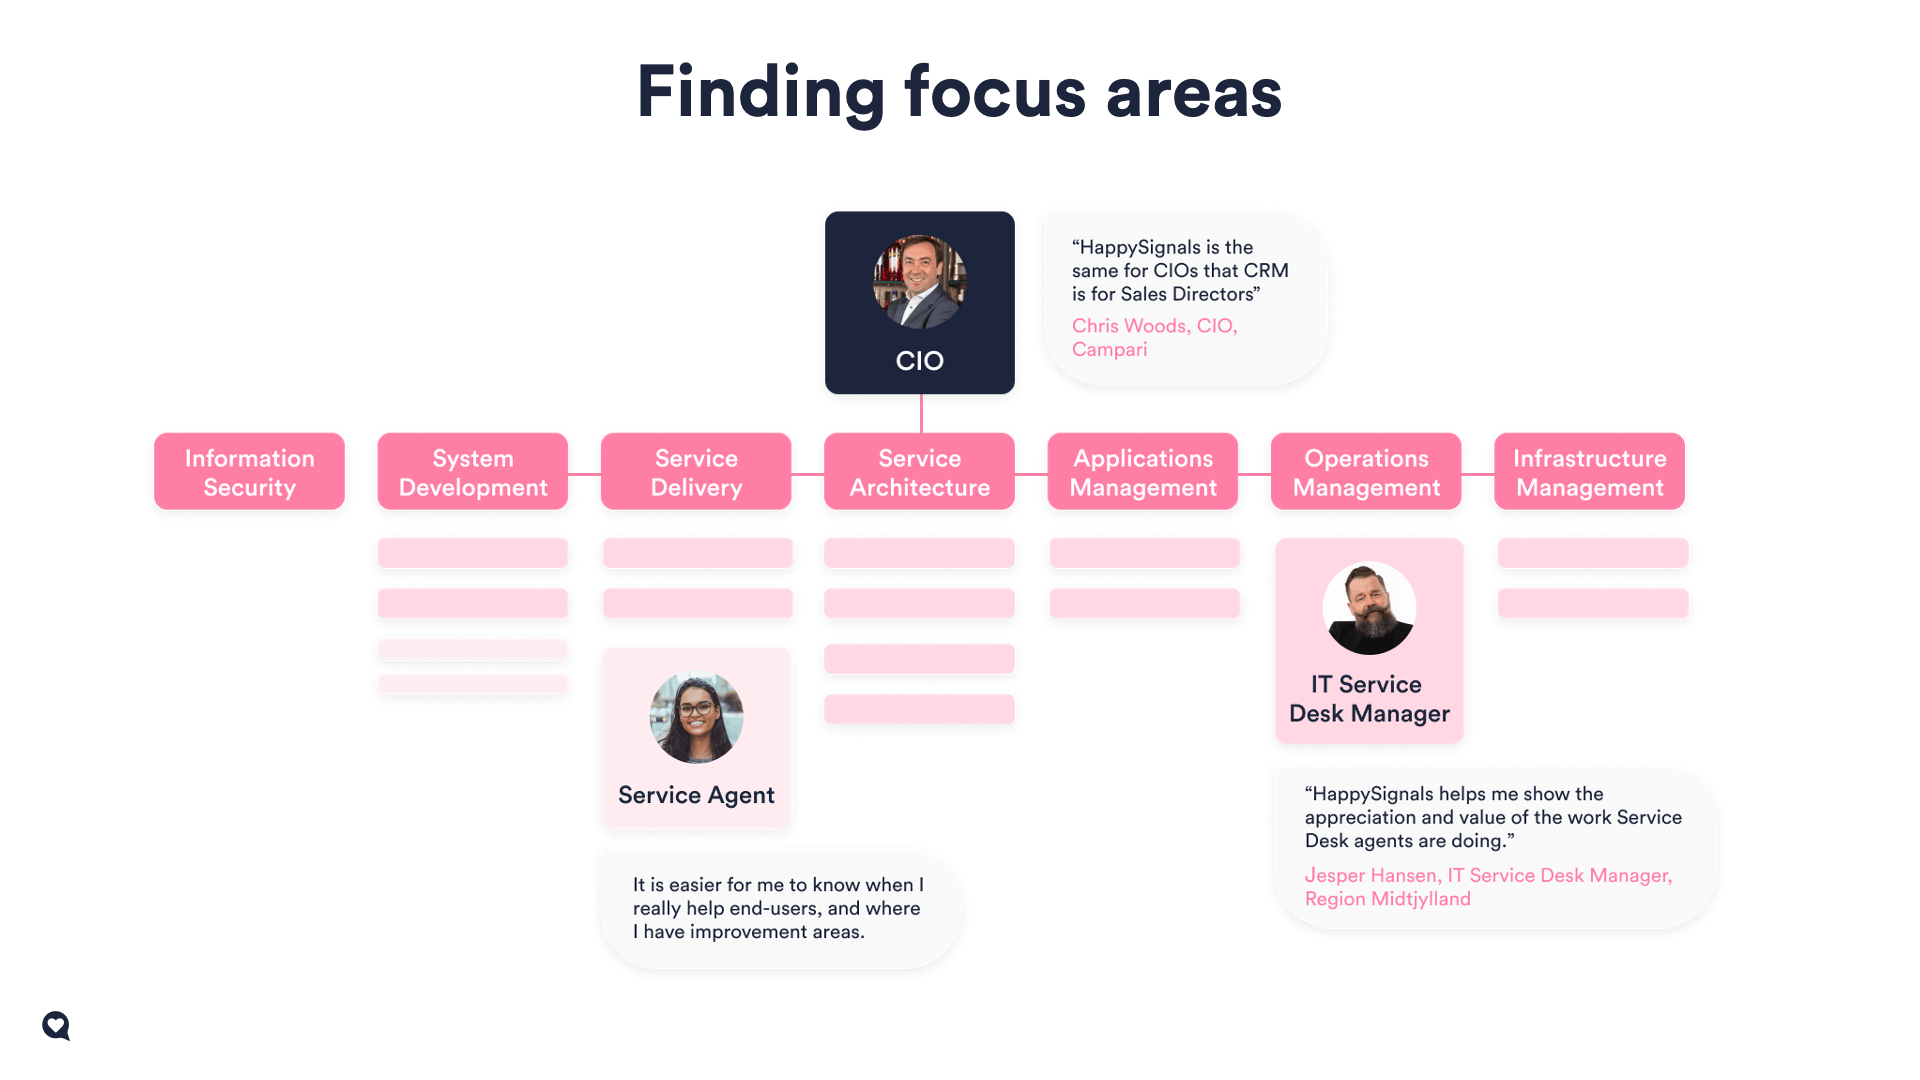
Moving away from other metrics to Experience can also increase the motivation levels for everyone in IT, from Service Agents to Service Owners and even external vendors.
Focusing on Experience means focusing on how you are helping end-users and enabling them to work more efficiently. This is a much more motivating goal for everyone in IT, compared for example with the target for Service Agents of closing tickets as quickly as possible.
Some of our customers have even seen that within several months of using the HappySignals IT Experience Management Platform, their Service Agents already reported increased happiness at work! Even for customers like Wilhelmsen, which outsources their service desk, the churn of their external partner’s agents who are serving them has dropped compared to those serving other customers.
This is not surprising at all. Service Agents’ motivation and learning increase when they can receive direct feedback through the HappySignals platform on how they are helping end-users, and how they can improve.
Happier agents want to serve your end-users better too – more smiles, less time wasted (for everyone!)
Drill down into Experience in different IT areas, countries, and departments with HappySignals
With the HappySignals platform, you can put into practice this Experience focus and understand how end-users are experiencing IT from many different angles. Using our demo environment (with demo data), let’s see how.
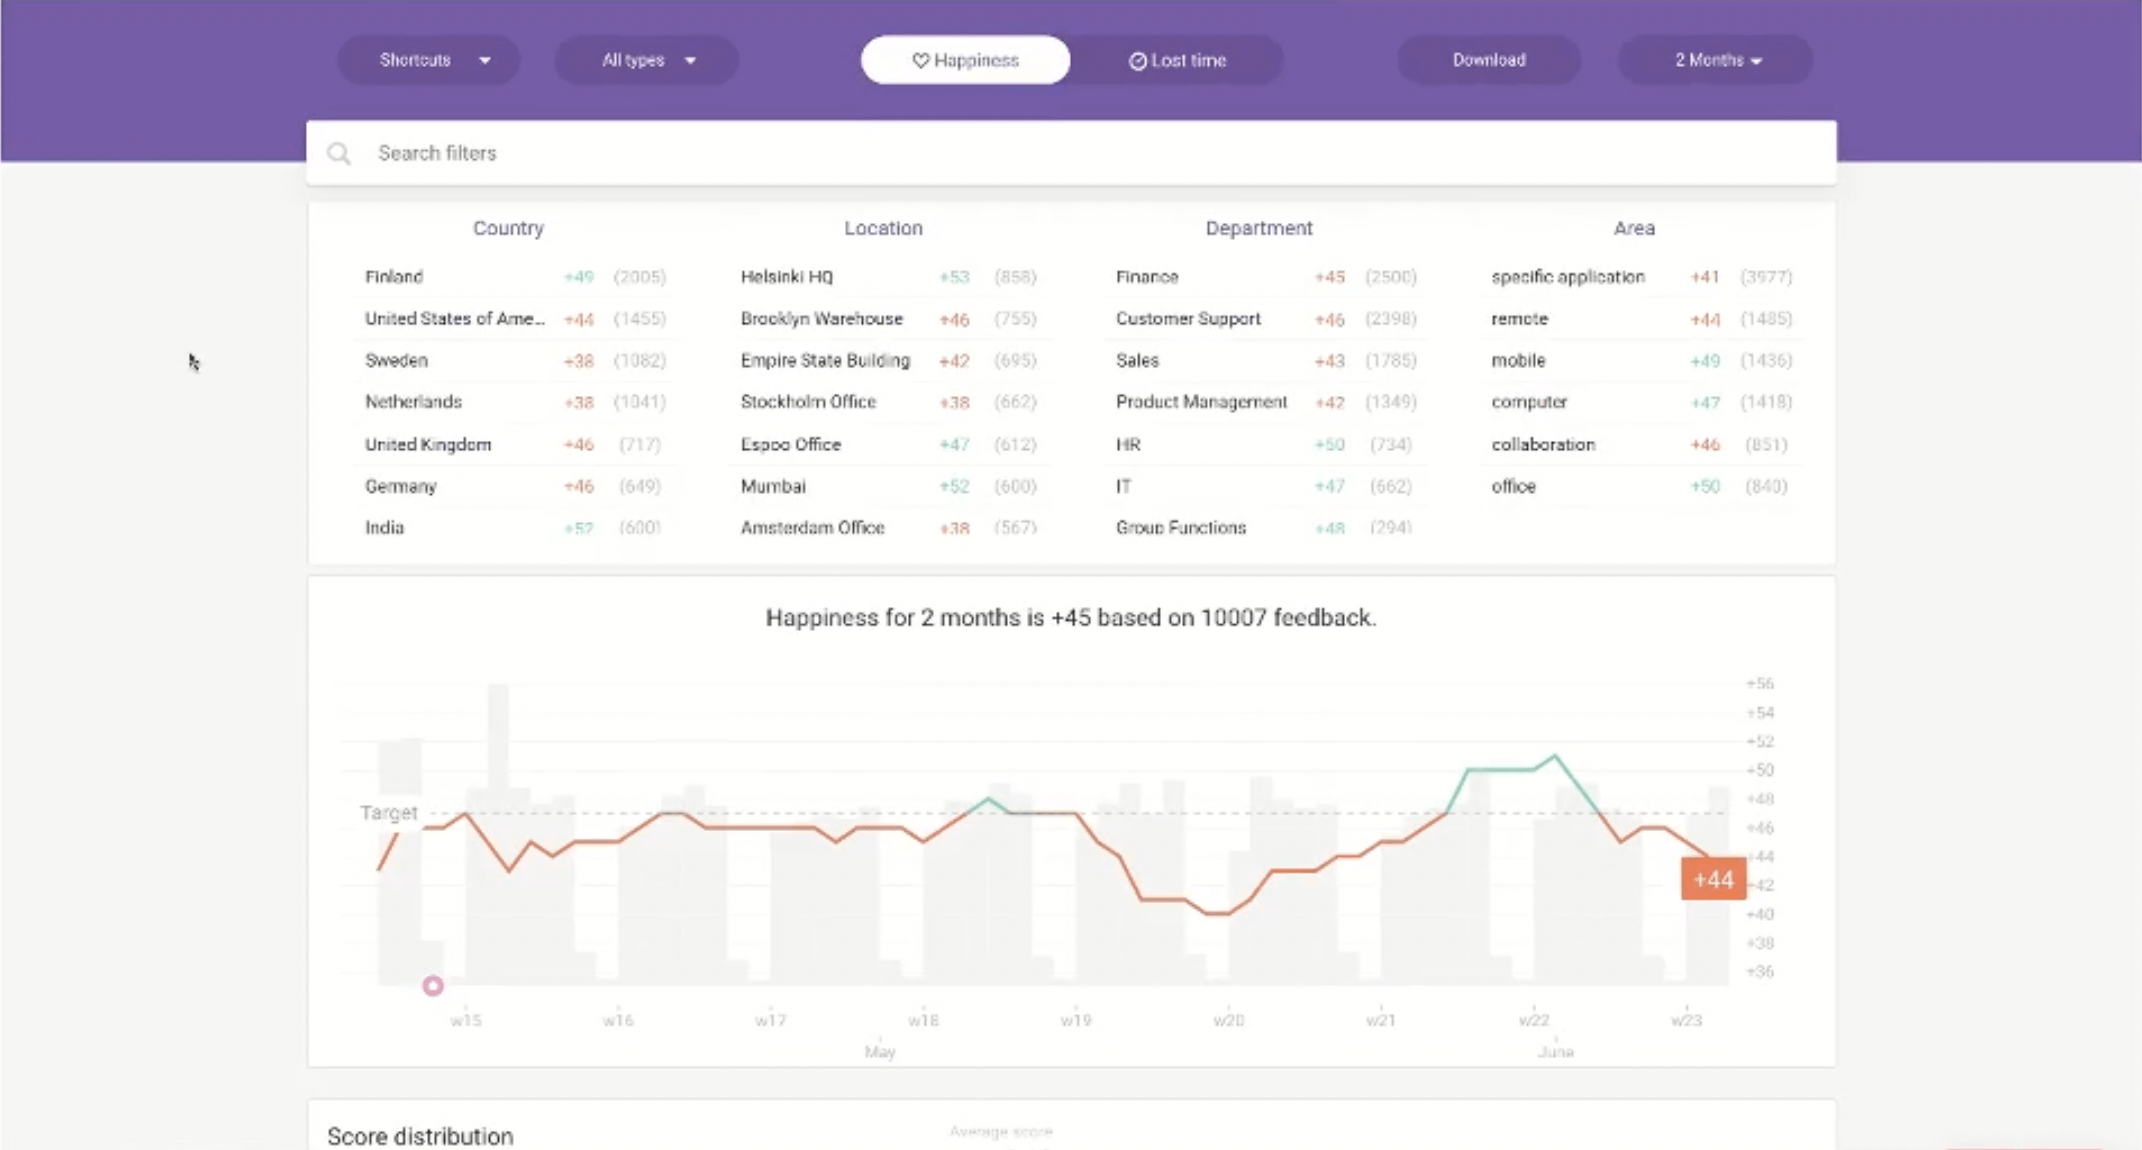
In this overall view below, CIOs see the big picture of how IT is performing across different countries, locations, departments, and IT areas. At one glance, they can understand what is contributing to end-user happiness or unhappiness, and make data-driven decisions about allocating resources to improving areas that need work.
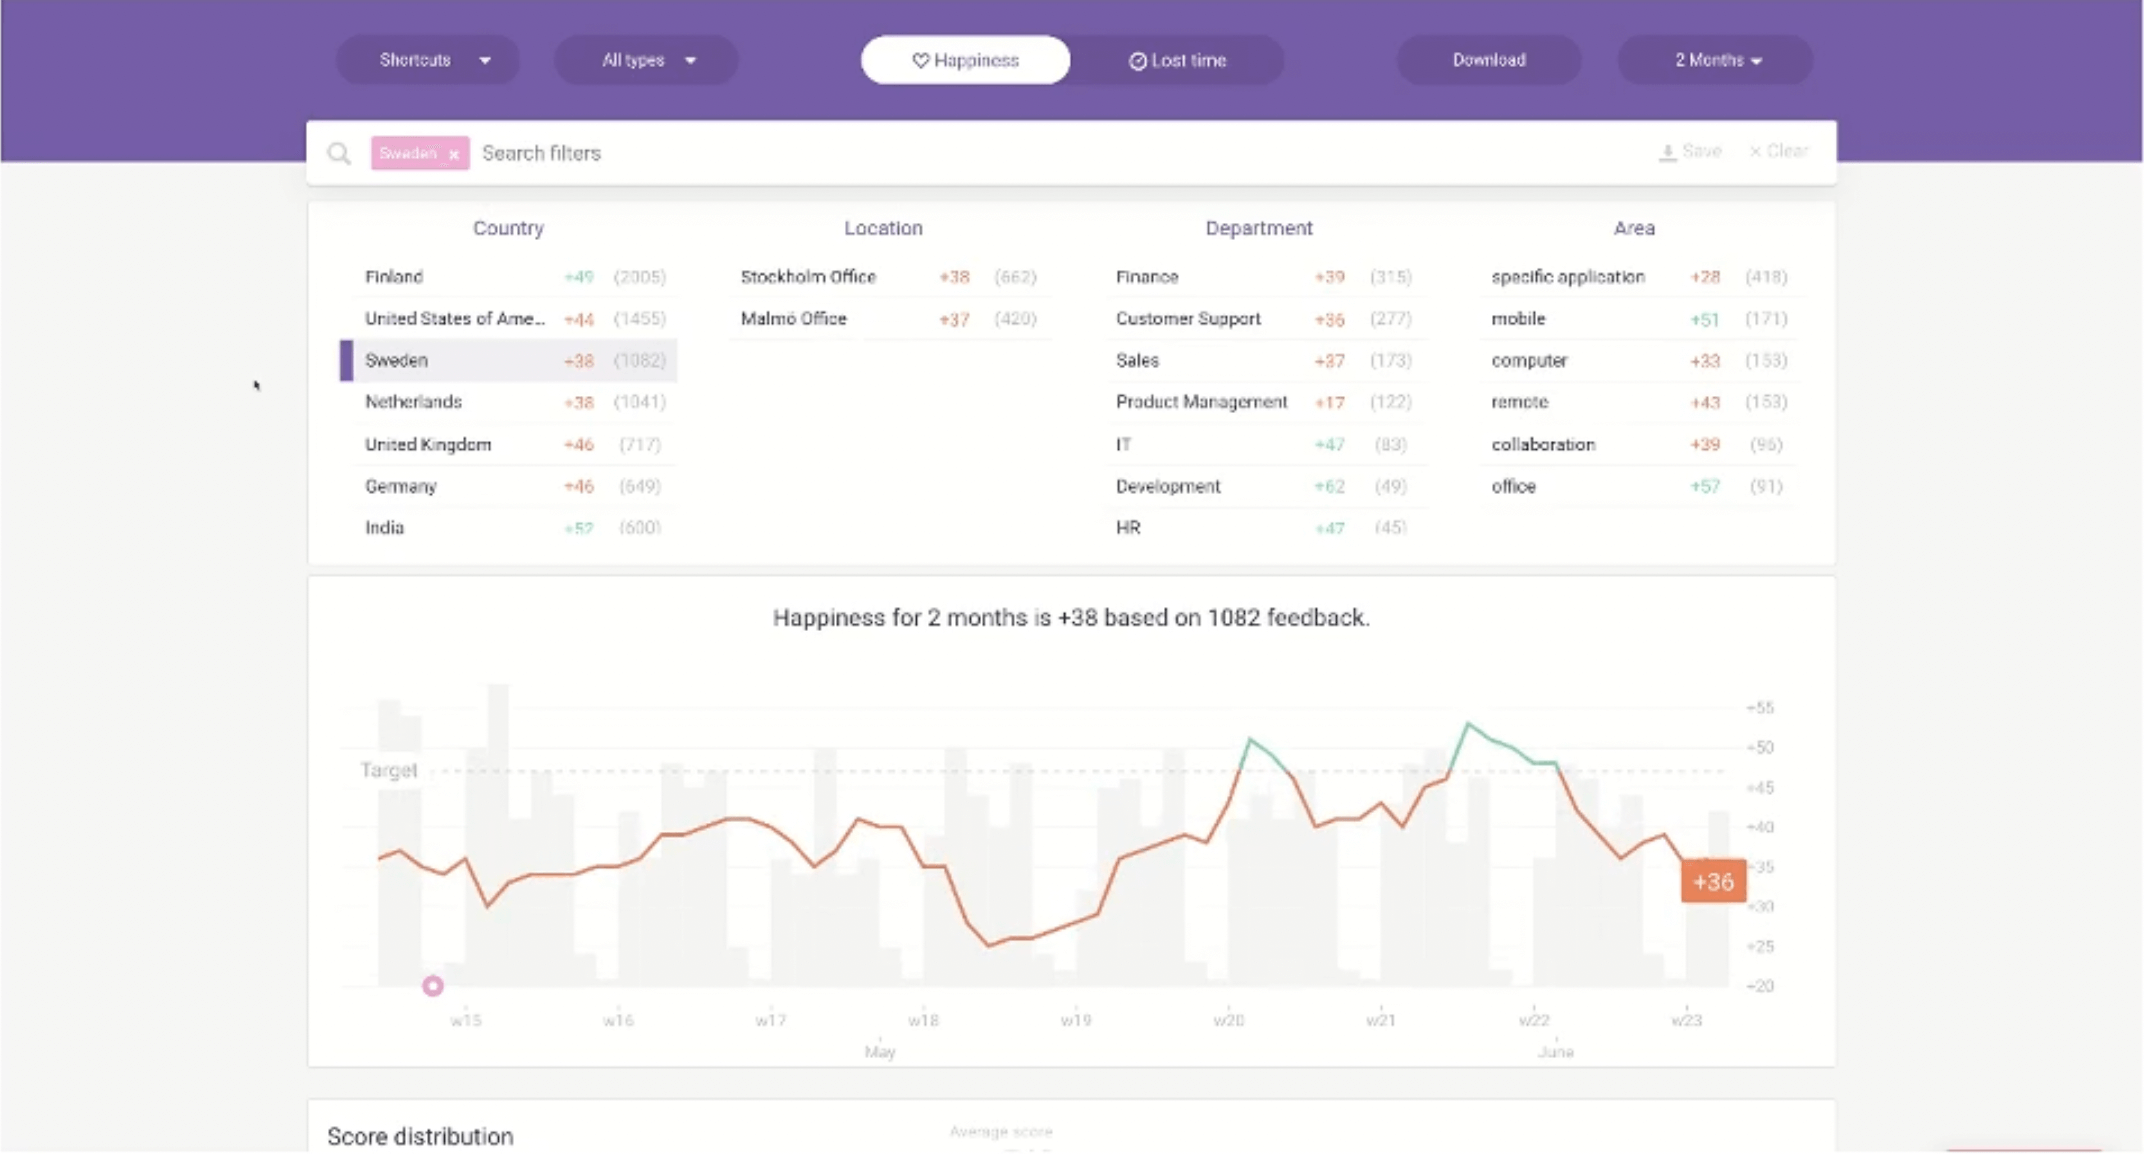
Beyond the CIO however, the platform also provides value for other members of your IT organization. Country Managers for example, can immediately see how the IT Happiness of end-users in their country is progressing. In the screenshot below, the country office in Sweden is selected.
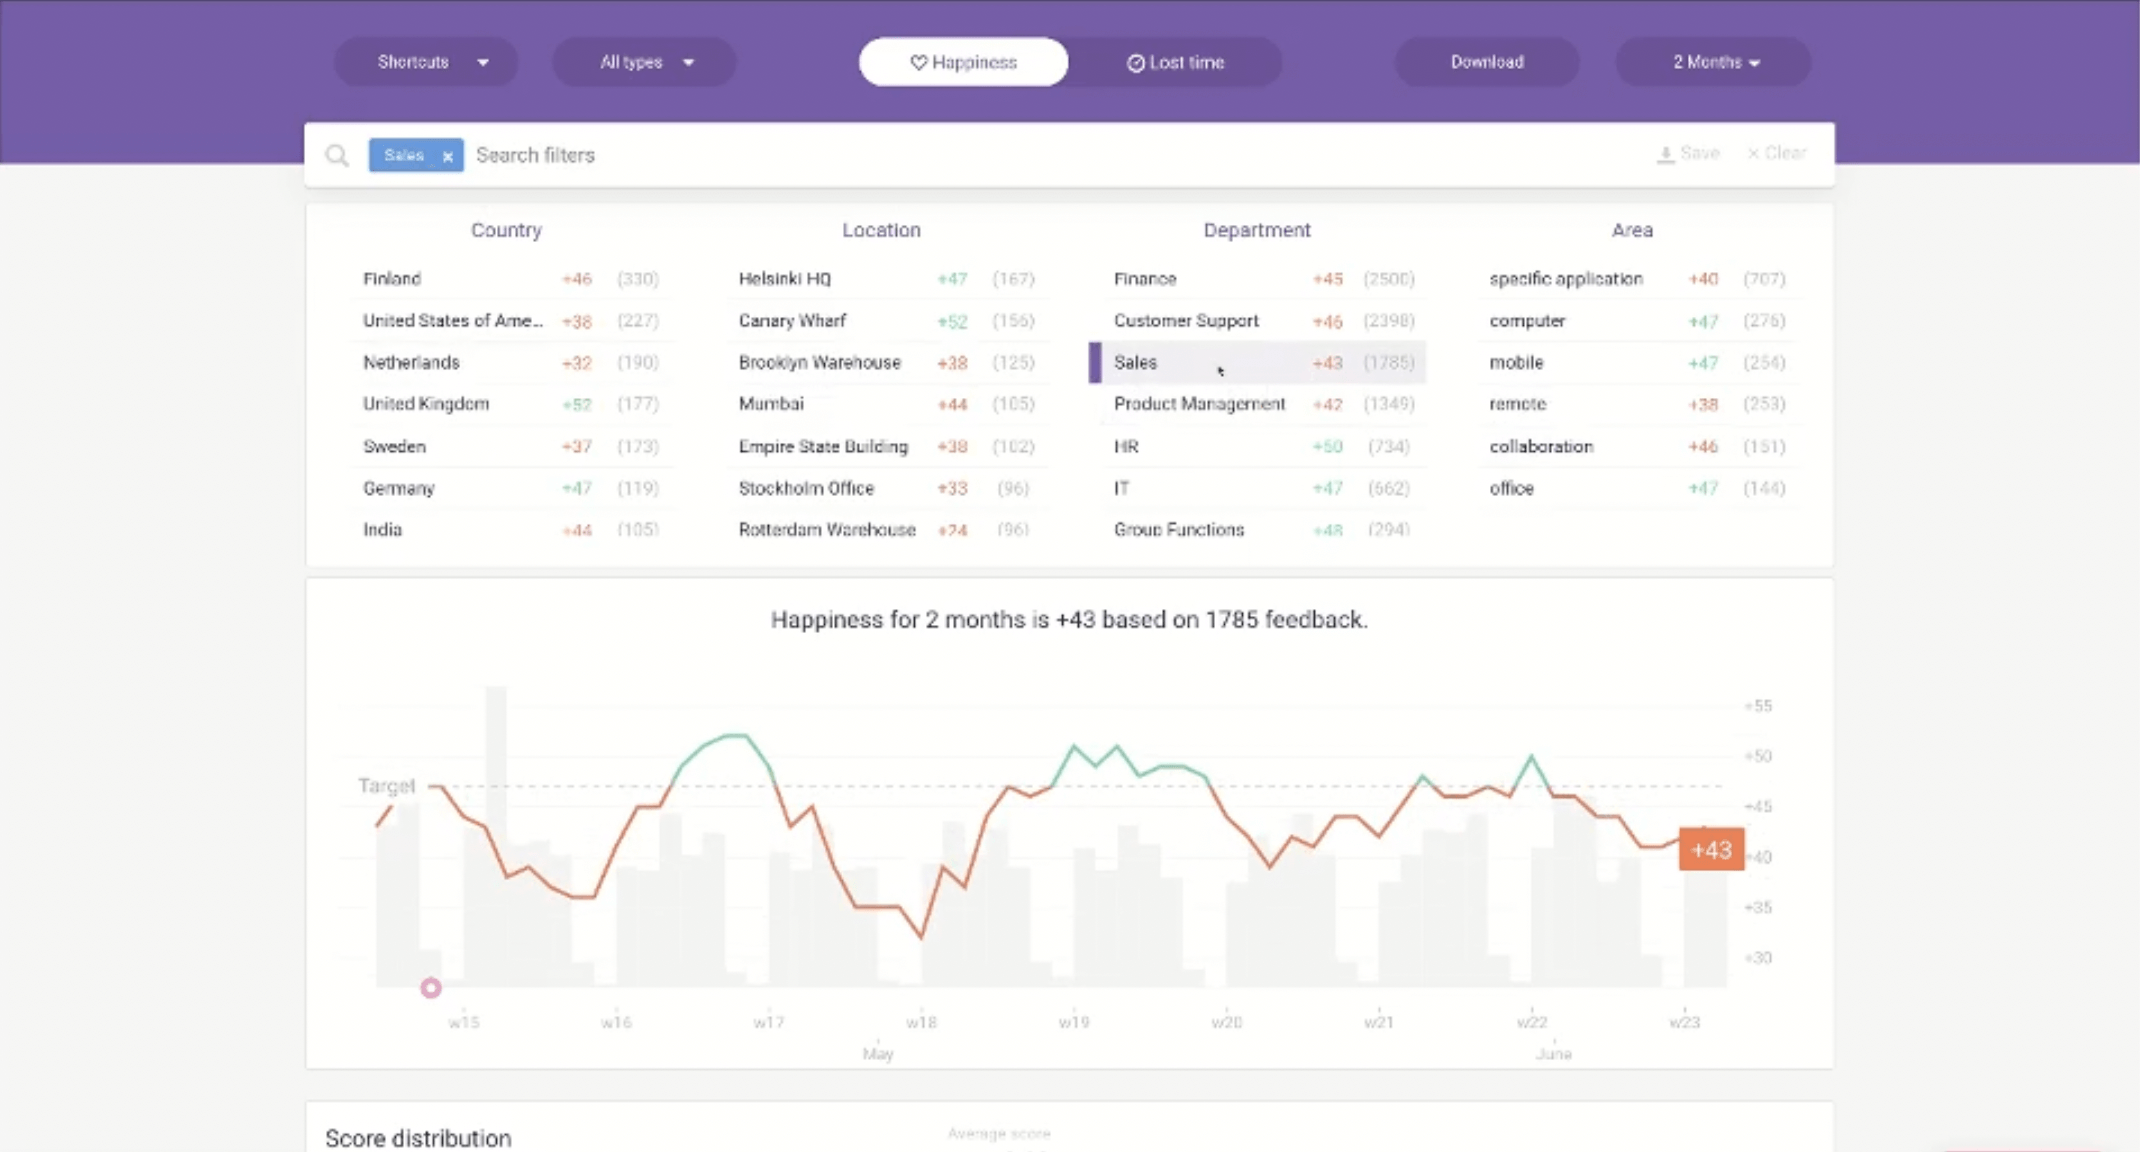
To provide end-users with the best IT experience possible, IT also needs to have the data to drive discussions with internal business units on how IT can better support employees in different departments. These more tailored discussions are important as employees in a Sales role, for example, may have specific IT needs that differ from employees in Product Management, Finance, or other departments.
For instance, if a Service Owner is having this discussion with the Sales team, the view below allows both parties to instantly see how Sales employees are experiencing IT. It increases transparency between IT and internal business units, and facilitates internal cooperation to work on areas that need improvement.
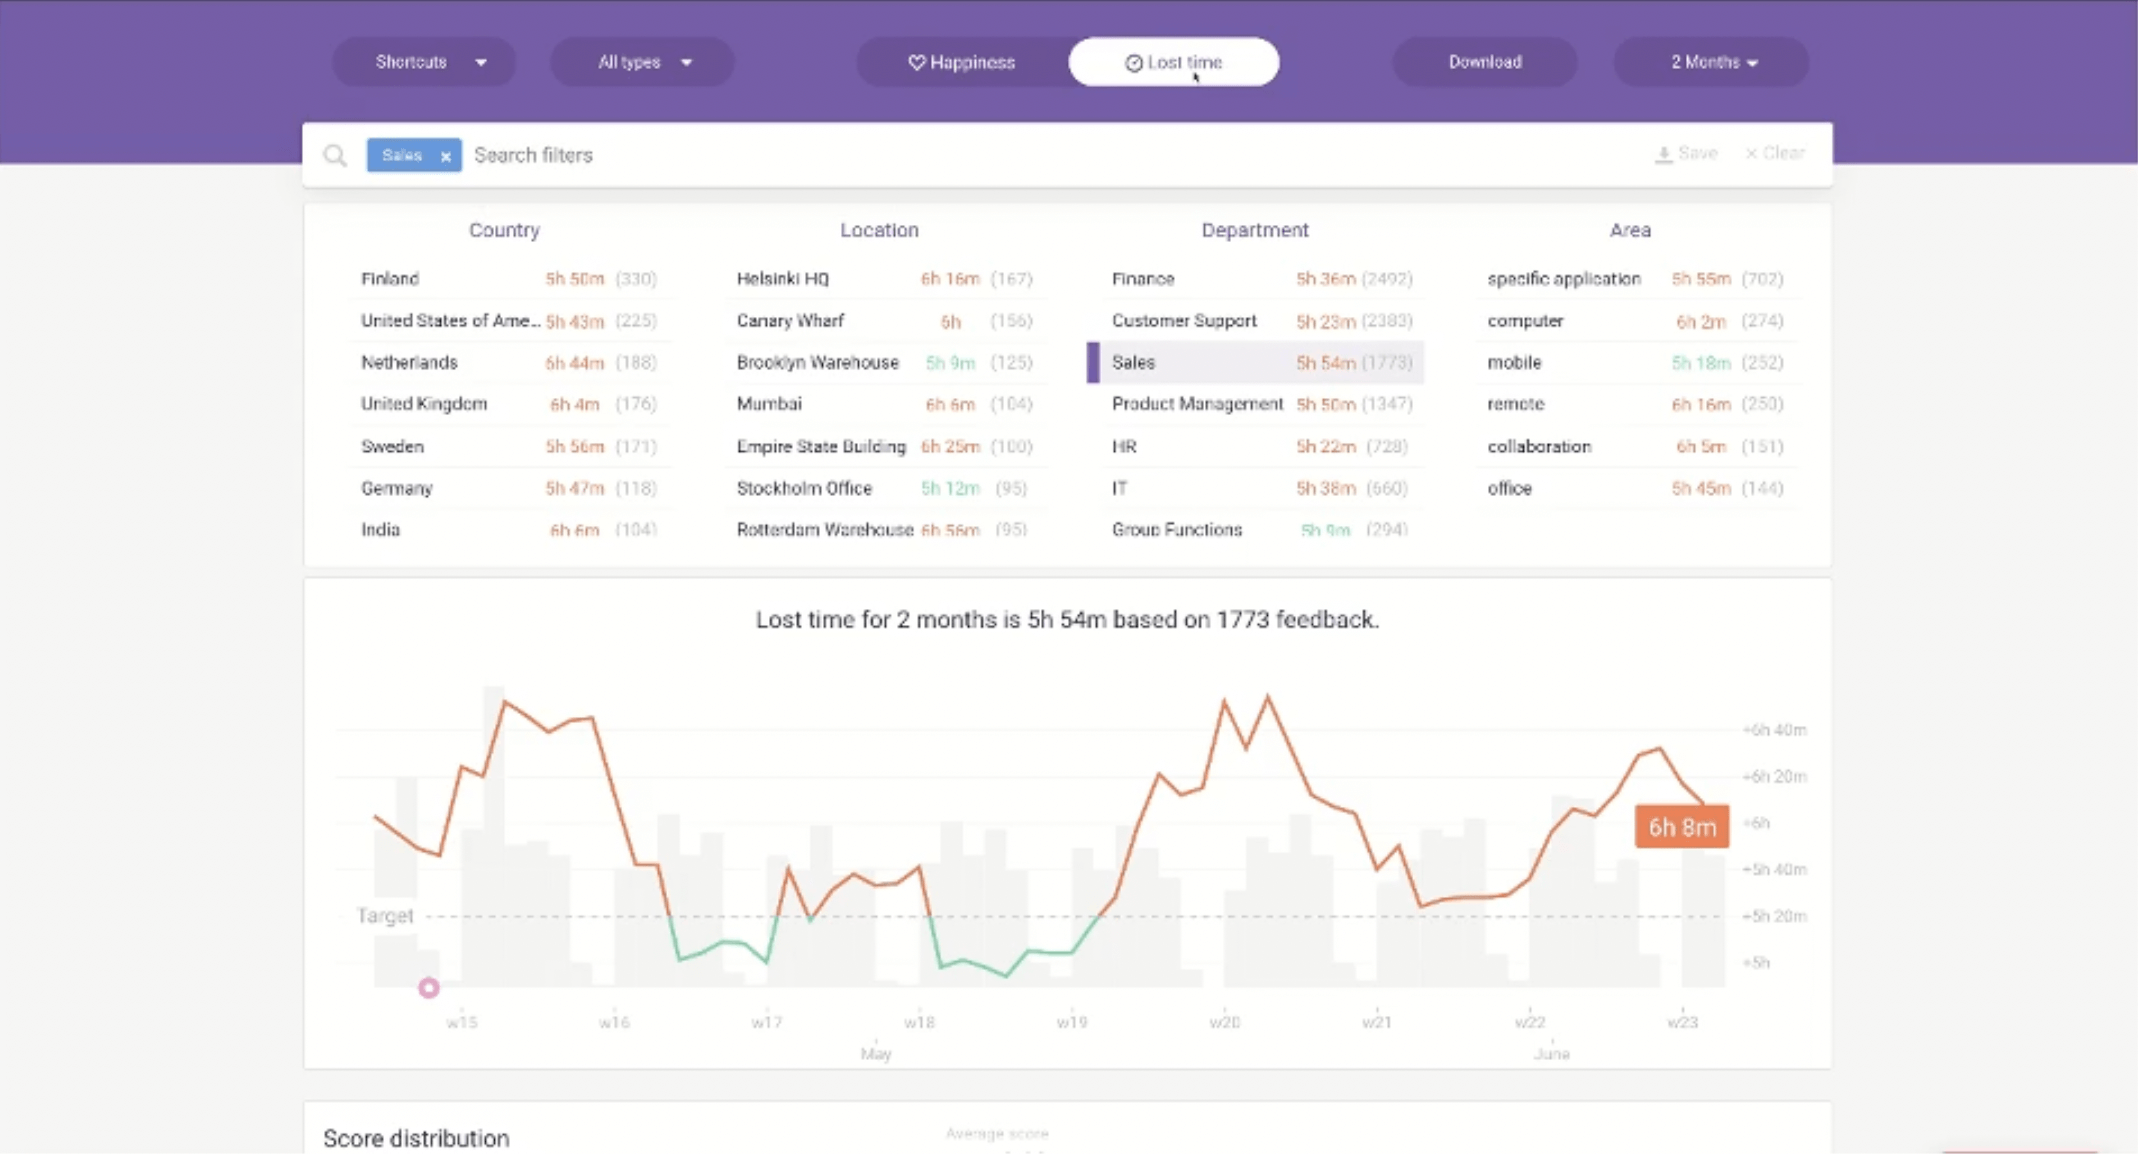
The platform also measures Lost Time, showing how much time end-users perceived to have lost due to their IT incidents or requests. Below for example, by looking at what is costing employees in Sales the most time, IT can prioritize areas for improvement that are most business-critical.
Empower your IT Management team with granular Experience Data
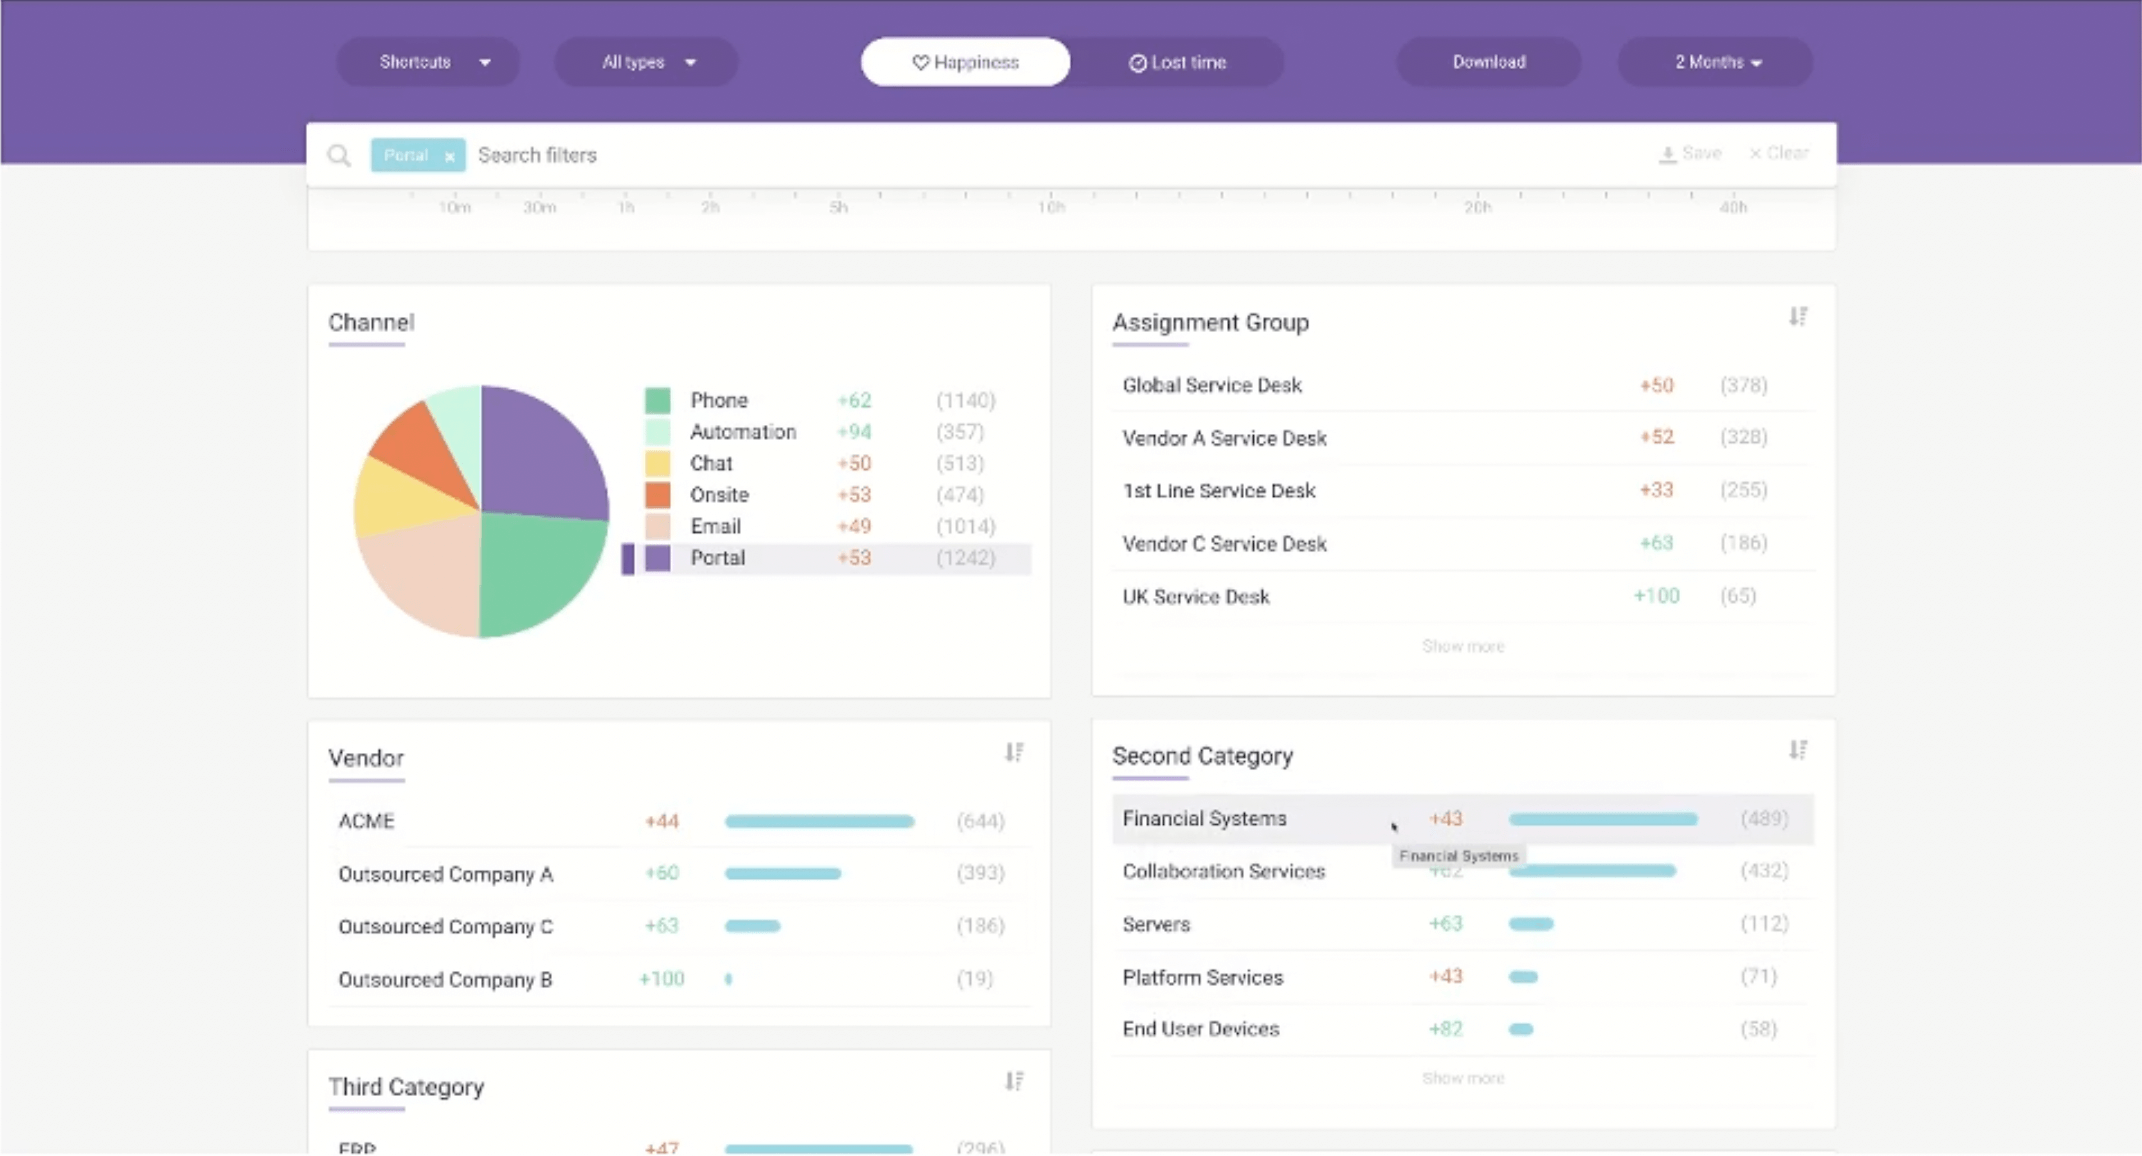
On the ITSM front, the people in your IT team that are responsible for different channels can also get access to granular data on how those specific channels are performing, as below.
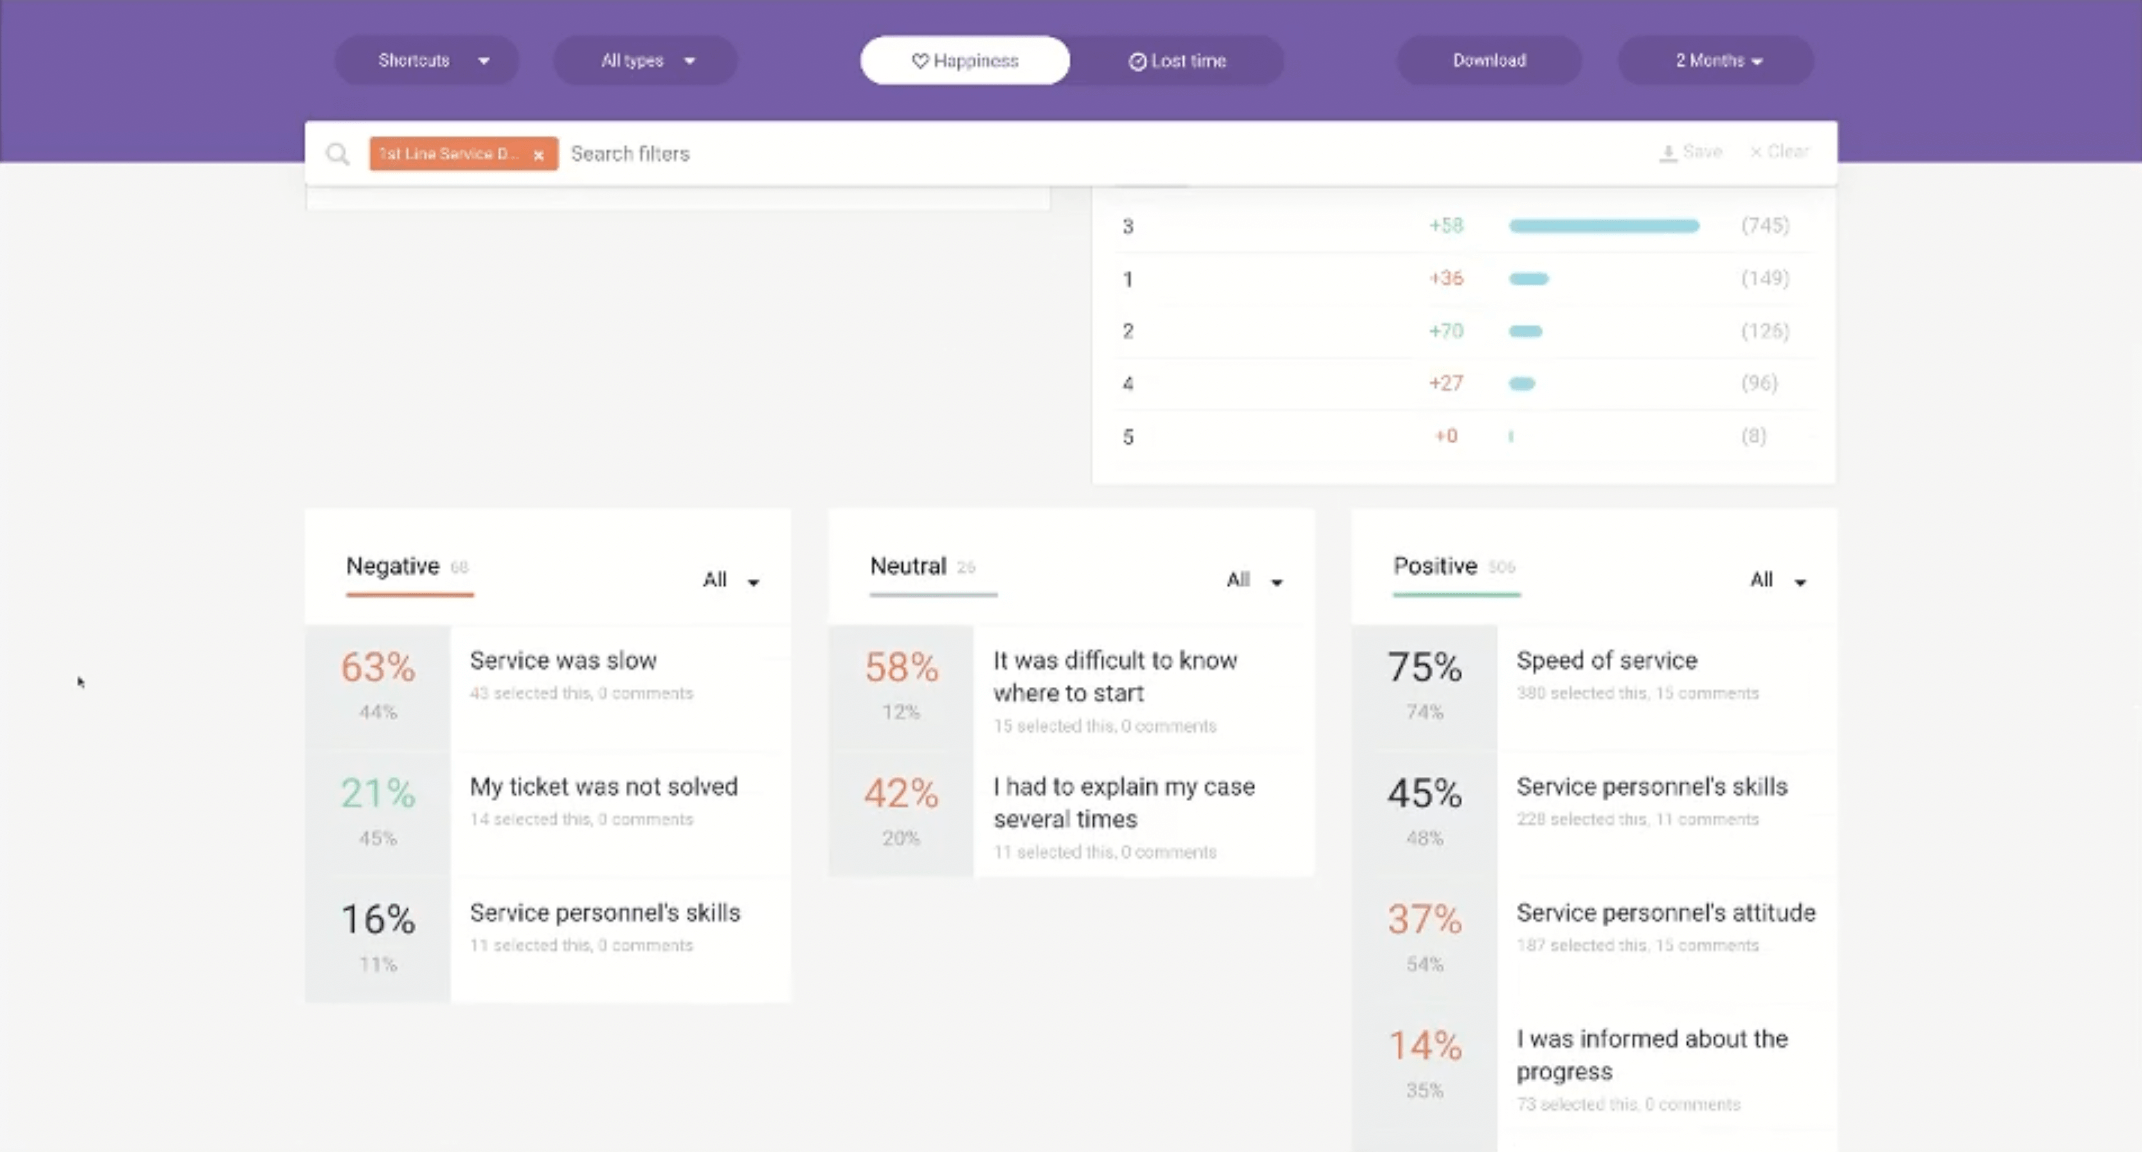
Beyond the numbers that provide common metrics for comparison and analysis, the qualitative understanding of why end-users are rating their experiences as such is equally valuable for Service Owners.
They can understand, as below, the factors that contribute to positive or negative IT experiences for end-users. Then, they can know how to improve.
Create Transparency and Alignment around Experience
Ultimately, making Experience a common goal for IT is not just talk. It is about giving everyone in your IT organization, from CIO to IT Directors and Service Owners, transparent access to real-time Experience Data from your end-users.
When everyone has a common multi-dimensional view of Experience, not just of the specific metrics used for isolated service management areas, you can begin to align their efforts to help end-users where they most need it. That’s the first step towards building a human-centric culture in your IT organization!
Watch the latest episode of Happy in 15, for a more interactive demo of how the HappySignals platform can support your IT team in focusing on Experience first. Or check out our full 11-min product demo to see all the features of the HappySignals Experience Management Platform for IT.
If you enjoyed watching this, be sure to subscribe to Happy in 15 and never miss an episode. If you prefer to read than watch, stay tuned for more blog posts like this one!
Looking for something even more bite-sized? Check out our recently released Learning Center, where we cover everything from XLAs to optimizing your ServiceNow.
Related content
7 minute read
03.08.2021
Why Continual Improvement Needs Employee Experience Data
Are your IT service desk’s continual improvement efforts missing an important something? Perhaps it has a good number ...
Read more >
15 minute read
20.04.2022
Continual Improvement Success Through End-User Happiness – A Customer’s Story
This blog shares the continual improvement success of Ahlstrom-Munksjö. Ahlstrom was founded in 1851 in Finland; ...
Read more >

