

Why Continual Improvement Needs Employee Experience Data
(Originally published in itsm.tools July 29, 2021)
“We know that things are wrong but we’re not sure why.” Does your IT organization resonate with this?
This blog explains how employee experience data highlights issues end-users face, enables you to understand their root causes, and implement the right solutions.
Are your IT service desk’s continual improvement efforts missing an important something? Perhaps it has a good number of IT support improvement opportunities, but no one knows the true root cause of the issues that need to be addressed – “We know that things are wrong but we’re not sure why.”
Or maybe you’re completely missing improvement opportunities because your use of traditional IT service desk metrics doesn’t highlight the issues that need improving.
To help, this blog explains how employee experience data can be used not only to measure outcomes and value, but also to highlight issues, better understand the root causes, and help construct the required solutions.
What’s needed for continual improvement success
Continual improvement is a vital part of IT service management (ITSM), but it needs more than an ITIL book and a heart full of hope.
Instead, continual improvement needs:
- Accurate data. Stop for a moment to consider what you’re improving right now? Are you sure that improvement is needed? Do you have access to data that shows this? Plus, do you have data that goes under the skin of the issue to understand the root cause(s), such that it’s clear what needs to be improved and how?
- The right focus. Are you improving the right things? Not from an IT perspective, but a business perspective. You’d be surprised at how many times an improvement of IT operations can sadly have a detrimental effect on business operations and outcomes.
How employee experience measurement helps with your continual improvement
Our customers find that employee experience measurement helps to answer all these questions. They are no longer struggling with customer satisfaction (CSAT) feedback levels of less than 10%.
Instead, they now have employee experience feedback levels above 25-30%. That feedback provides a constant real-time view of IT performance, such that they can trust the results as an accurate view of how IT support is helping or hindering their organization’s employees.
For example, our latest aggregate customer employee experience data, showed the top three contributing factors to employee happiness to be:
- Speed of service
- Service personnel’s attitude
- Service personnel’s skills
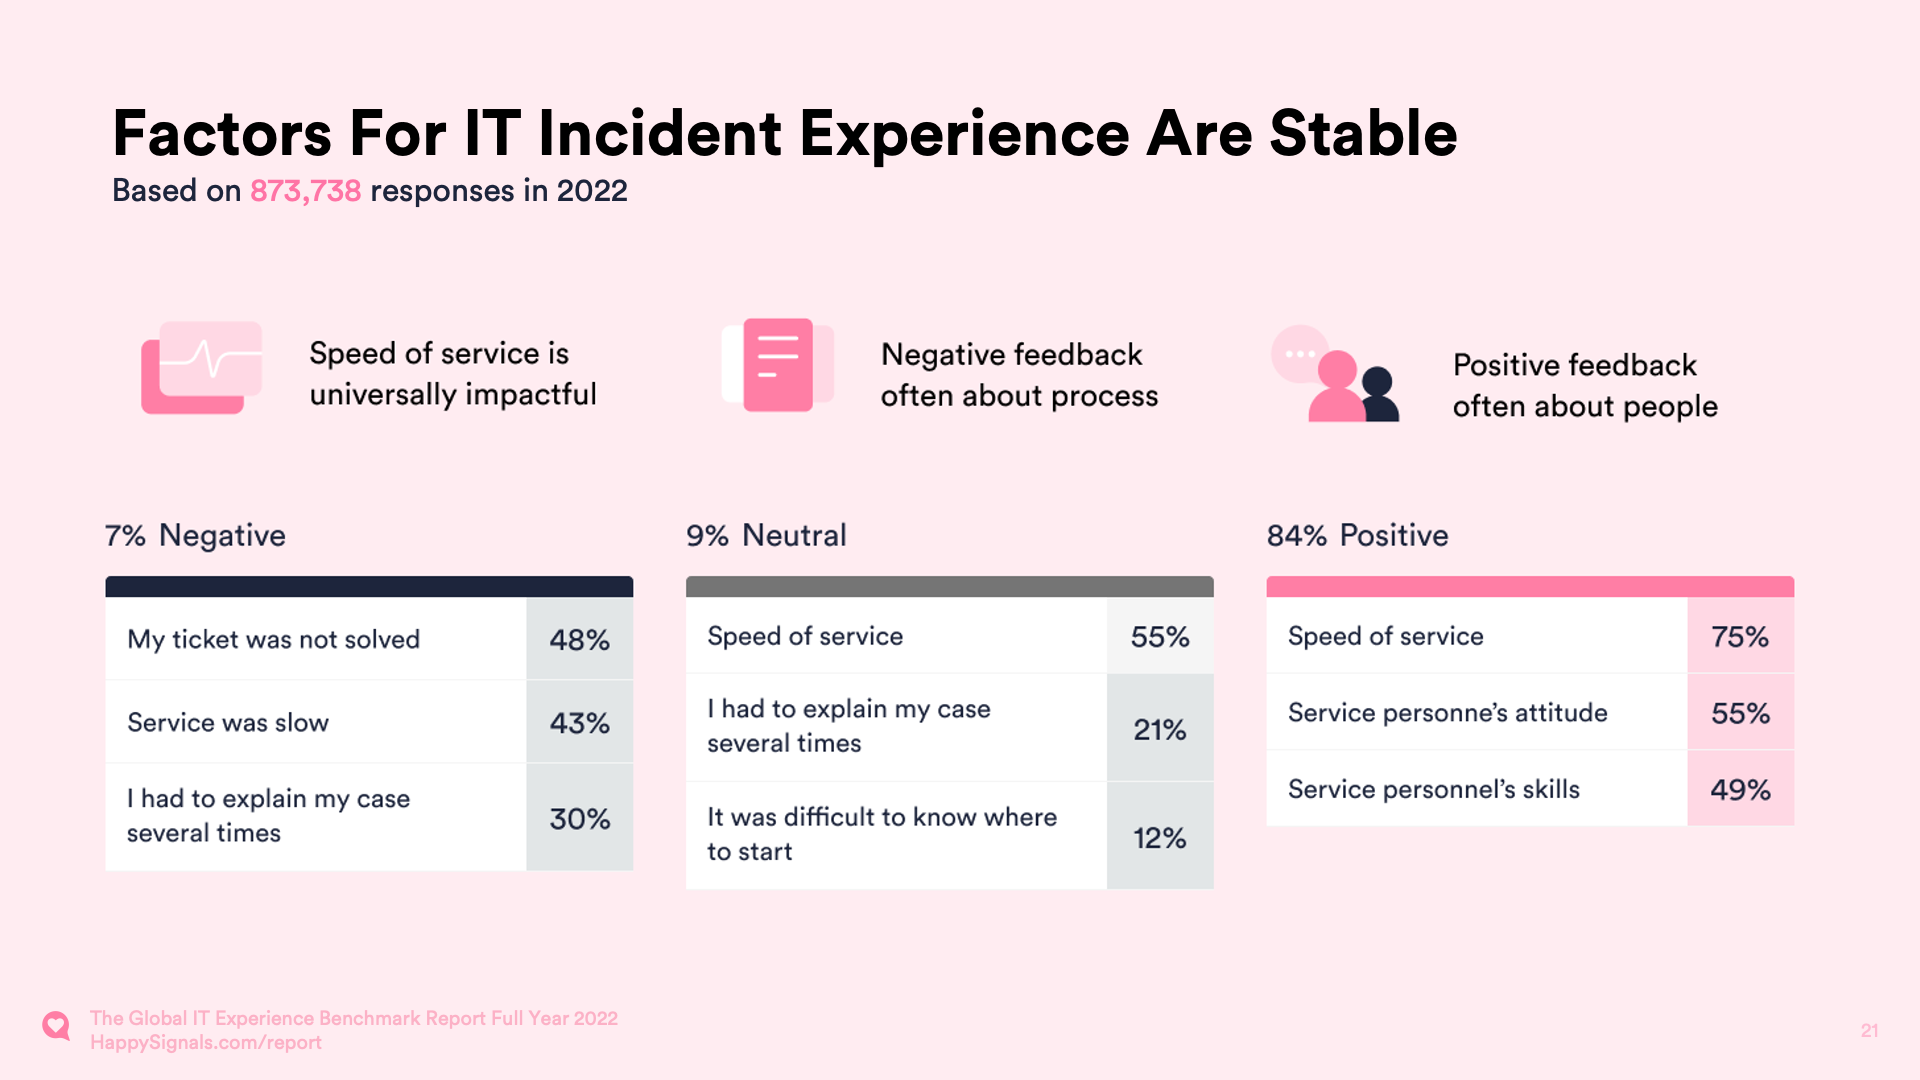
Whereas the top three contributing factors to employee unhappiness were:
- Their issue not being solved despite ticket closure
- Slowness of service
- Having to reexplain the issue and provide details repeatedly, i.e. being bounced between people
Hence, if you were measuring employee experience, you’d have accurate data on what works and what doesn’t. Then, you can not only identify improvement needs but also be able to prioritize and focus improvement efforts.
As an example, a deeper analysis of the third most contributing factor for employee unhappiness highlights the adverse impact of bouncing on both happiness and productivity loss:
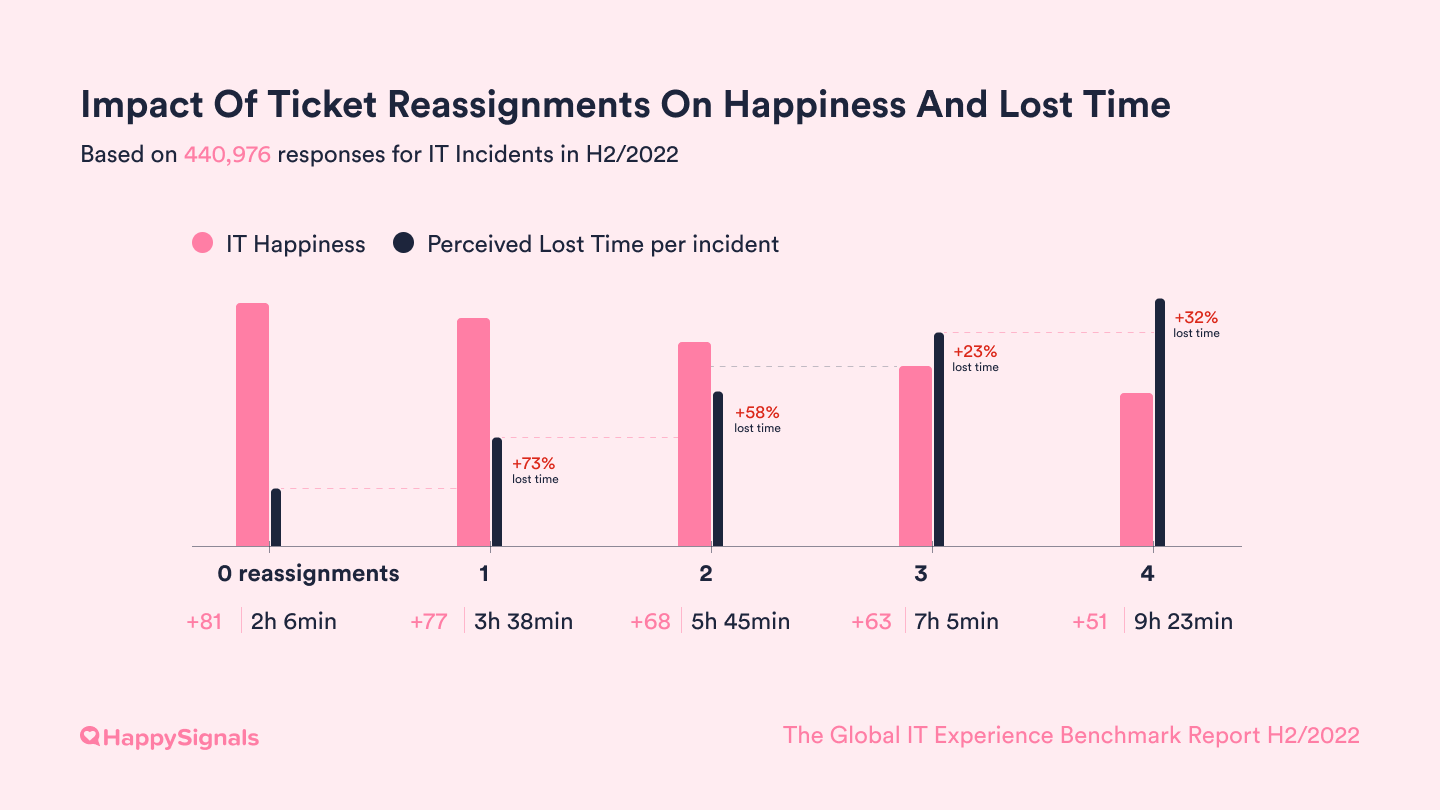
Importantly, this is accurate data, not just a gut feeling or assumption that multiple ticket bounces adversely affect employee productivity and happiness.
Check out an article we wrote on minimizing ticket bounces, if this is potentially something that would improve your IT service desk’s operations and outcomes.
Two tips for improving your continual improvement
In addition to having access to accurate data, our customers consistently find that two factors help with their continual improvement:
- Setting visible targets
- Communicating frequently on future improvements
Tip 1: Setting visible targets
Let everyone know that you have an improvement initiative and how it will positively impact them. For example, our customer Ahlstrom-Munksjö started 'Project Happy' – a continuous improvement program to solve end-user satisfaction issues identified from HappySignals employee experience data.
Align your entire IT organization around the most important improvement you wish to achieve for end users. This gives members of your IT organization a meaningful target to work towards that relates to improving end-user experiences, not just to fulfilling parameters of project delivery such as a deadline.
Tip 2: Communicating frequently on future improvements
Another good practice is the "three-month model”. This involves an improvement-focused meeting with senior management / directors every three months.
It might not sound that radical but, importantly, the meeting’s focus should not be on what has been achieved, as is often the case in review meetings, but on what should be improved next.
Coming back to having access to accurate data, our customers find it’s much easier to get senior management to commit to new improvement initiatives when their recommendations are based on employee experience data.
Which IT director wouldn’t be interested in what >2000 employees, for example, feel about their services? Or in how their IT performance compares with aggregated employee experience benchmarks, as shared in our Global IT Experience Benchmark H2/2022 Report?
Hopefully, this article has helped you to appreciate how employee experience data can be used to enable and support continual improvement in many ways.
Watch this 3-min demo on how the HappySignals Experience Management Platform enables you to identify improvement areas in real-time.
Related content

20.04.2022
Continual Improvement Success Through End-User Happiness – A Customer’s Story
This blog shares the continual improvement success of Ahlstrom-Munksjö. Ahlstrom was founded in 1851 in Finland; ...
Read more >
30.07.2021
Make Experience a shared goal for IT
Enterprises today have increasingly complex IT environments with different touchpoints and end-users in different ...
Read more >