The 9th Global IT Experience Benchmark: H2/2022

In total, 1,642,555 end-user responses in over 130 countries were collected and analyzed in 2022. In this report, we focus on Overall IT Experience of enterprise end-users and IT Experience Management maturity among our customers.

HS_Report_hero

Understand how you can improve IT Experience for your end-users

If you're a CIO, IT Leader, Experience Owner, or Service Owner wanting to make informed decisions based on experience data, this report is for you.

 
Our Benchmark report is about how internal end-users perceive enterprise IT and how IT uses experience management (ITXM) practices in their work. 
 
The IT Experience data in this report is based on 1,642,555 end-user responses. In addition to the end-user data, we conducted a separate survey among our customers to understand their ITXM maturity and ways of working. 

H22022-Report_Download-Full-Now-CTA-square


Key Takeways


  • IT Support services have the most significant impact on the Overall IT Experience of end-users

  • The key benefits of IT Experience Management are happier end-users, focused IT teams, better decisions, and more motivated IT employees

  • Fewer sanctions are linked to service desk KPIs than two years ago

  • More than 30% of companies have or plan to start creating an Experience Management Office (XMO) 

  • Service Portal happiness has increased +22 points in the last year.

  • More incident tickets are submitted through service portals for the first time than email and phone combined.

Contents


The State of ITXM in 2023

About the Benchmark Data

1. How happy are end-users with different IT touchpoints?

Insights about the global IT experience for Enterprise end-users across different touchpoints.

2. Overall IT Experience - the reputation of IT?

3. Geographical Differences in IT Happiness

4. IT Experience Management maturity

Separate survey results about the ITXM maturity and ways of working among HappySignals customers

5. IT Service Desk Benchmarks data

5.1 IT incidents

5.2 IT incident factors for happiness

5.3 IT incident channel distribution 

5.4 Ticket reassignments

5.5 IT Support Profiles 

5.6 IT Requests

5.7 IT Request channel distribution

5.8 IT Request factors for happiness

The Final Takeaway


Findings

 
  • The State of ITXM in early 2023
    • A significant increase in awareness of Experience Management in IT
    • Different approaches for experience management are emerging
    • Understanding differences in definitions and approaches is important
    • HappySignals believes the human aspect of IT experience should be approached with the same level of sophistication as the technical- and process-related matters.
      • This ensures a real understanding of how end-users perceive value when improvements are made. 
 
Enterprise employee IT Experience awareness has rapidly improved over the last 12 months. This increased interest leads to more stakeholders seeing opportunities in experience management. With more and more case studies proving the hard and soft benefits of experience management, one would have to live under a rock not to see the momentum experience has gained in enterprise service management. 
 
Broader interest means more eyes on experience management and more smart people working on capitalizing on experience management. Consultants, service providers, vendors, and enterprises are trying to determine what definitions to use, which stakeholders to involve, and how to choose suitable tools. 
 
Looking online, one will find many different definitions for Digital Experience, IT Experience, Customer Experience (CX) for IT, Digital Employee Experience (DEX), and Experience Level Agreements (XLAs).  
 
The clarification around what IT or digital experience is is welcome, as in 2021 and the beginning of 2022, it had many people scratching their heads, wondering what all this experience talk was about. At HappySignals we see Digital Employee Experience being an umbrella term including aspects of People, Process, and Technology related matters.


DEX-and-ITXM

With different vendors, consultants, and service providers now offering guidance, templates, models, and opinions on XLAs and DEX, it’s more important than ever to ask: “How do you define experience? How do you measure it, and who is meant to use it?” 
 
Since 2014, HappySignals has been focused on a very simple principle: only people can experience things. The gold standard of knowing how IT is doing is asking how IT end-users perceive their experience and productivity with IT.


Data source and collection methodology

The Global IT Experience Benchmark H2/2022
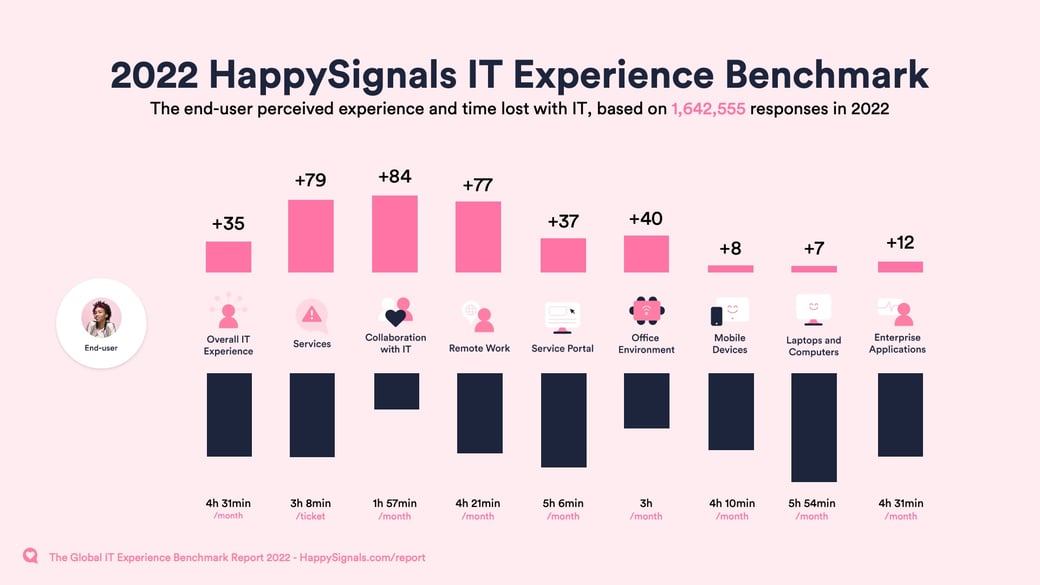
 Report presents and analyzes data from 1,642,555 end-user responses collected through the HappySignals IT Experience Management Platform between January-December 2022.

On this webpage, we mainly included the 2022 data and a few selected trends across time (from before H2/2022).

Where does the data come from?

Our benchmark data is collected from all HappySignals customers. These include large enterprises, as well as Managed Service Providers (MSP) who use the HappySignals Platform with their customers – enterprises and public sector organizations. 
 
About 60% of HappySignals customers are using Outsourced Service Desk providers. 
 
All responses are from IT end-users – employees using internal IT services – and reflect their feelings and perceptions about IT. 

How is the data gathered?

HappySignals IT Experience Management Platform connects operational data (e.g. from customers’ ITSM platforms) with continuous survey data from end-users about Ticket-based IT and Proactive IT areas.

Ticket-based IT (Incidents and Requests):
End-user responses are collected immediately when tickets are resolved. Surveys are sent after each ticket, asking end-users to accept the resolution by giving feedback about their experience. The average response rate for HappySignals customers is around 25-30%.

Proactive IT:
Surveys are sent proactively to end-users about Proactive IT areas (e.g. Overall IT Experience, Enterprise Applications, Laptops and Computers, Remote Work, Office Environment), rather than in connection with tickets. These surveys can be scheduled to target relevant end-users at optimal frequencies, enabling continuous measurement of non-ticket-based IT areas.

Data about IT Experience Management Maturity and ways of working:
This report includes some analysis of ITXM maturity among HappySignals customers. This data was collected through a separate survey that we sent to our customers in January 2023. The data contains answers from enterprise IT professionals. The survey was not sent to representatives of outsourced IT service providers on this occasion. 

What data is gathered?


Happiness:
End-users rate how happy they are with the IT area being measured (e.g. recent ticket-based service experience, Enterprise Applications, Mobile Devices, etc) on a scale from 0-10.


HappySignals then calculates: % of 9-10 scores - % of 0-6 scores = Overall Happiness (a number between -100 to 100).

Productivity:
End-users estimate how much work time they lost due to the IT area being measured.

Factors:
End-users select from a list of suggested reasons – which we call Factors – that influenced their Happiness rating. Multiple factors can be selected.

The surveys automatically tailor the factors shown to each end-user depending on what IT area is being measured, and whether the Happiness rating given in the first question was positive, negative, or neutral. Examples of factors include “It was difficult to know where to start” (Ticket-based Services) and “Applications are too slow” (Enterprise Applications).


Chapter_1_HSReport

Chapter 1:

How happy are end-users with different IT touchpoints?

IT Happiness across all measurement areas

Key insights

  • Ticket-based services (incidents and requests), Collaboration with IT, and Remote Work are still the highest rated areas of IT. 
  • Service Portal Experience has gone up again and reached +37, which means service portal experience has increased by +22 points between full year results 2021 and 2022.  
  • While end-users feel they lose more time with Remote Work than with Office Environment-related issues, they still rate Remote Work +37 points higher than Office Environment.


Slide3


Measurement Areas 2021 Happiness 2022 Happiness
Overall IT Experience n/a +35
Services +77 +79
Collaboration with IT +82 +84
Remote Work +64 +77
Service Portal +15 +37
Office Environment n/a +40
Mobile Devices -4 +8
Laptops and Computers +13 +7
Enterprise Applications +16 +12


NB! Numbers may vary from the last report due to data quality improvements, which have been applied to historical data as well for better comparability. Scores are calculated with the same mathematical model as NPS. (Read about What is the difference between NPS and HappySignals?)


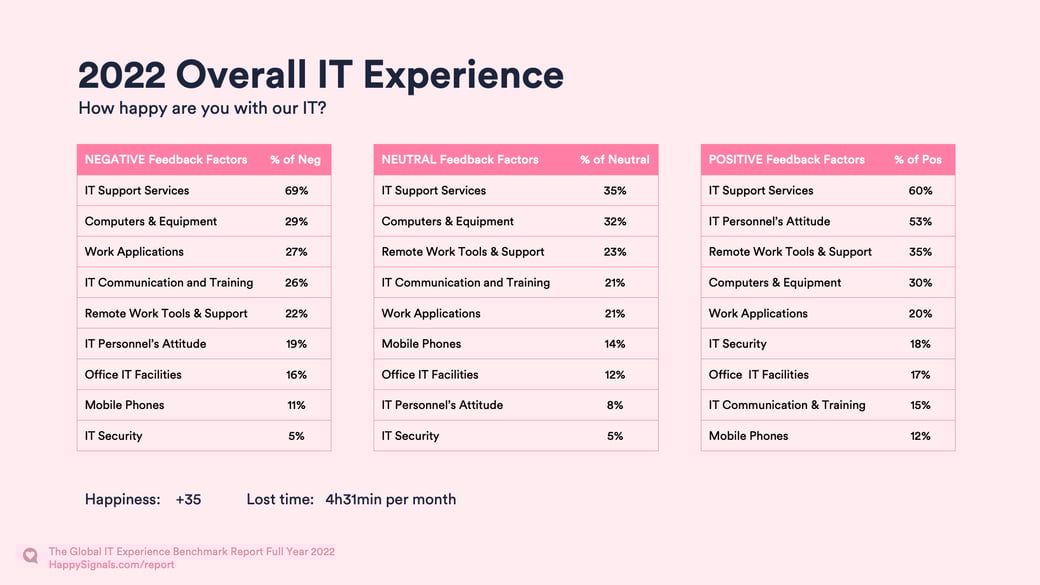
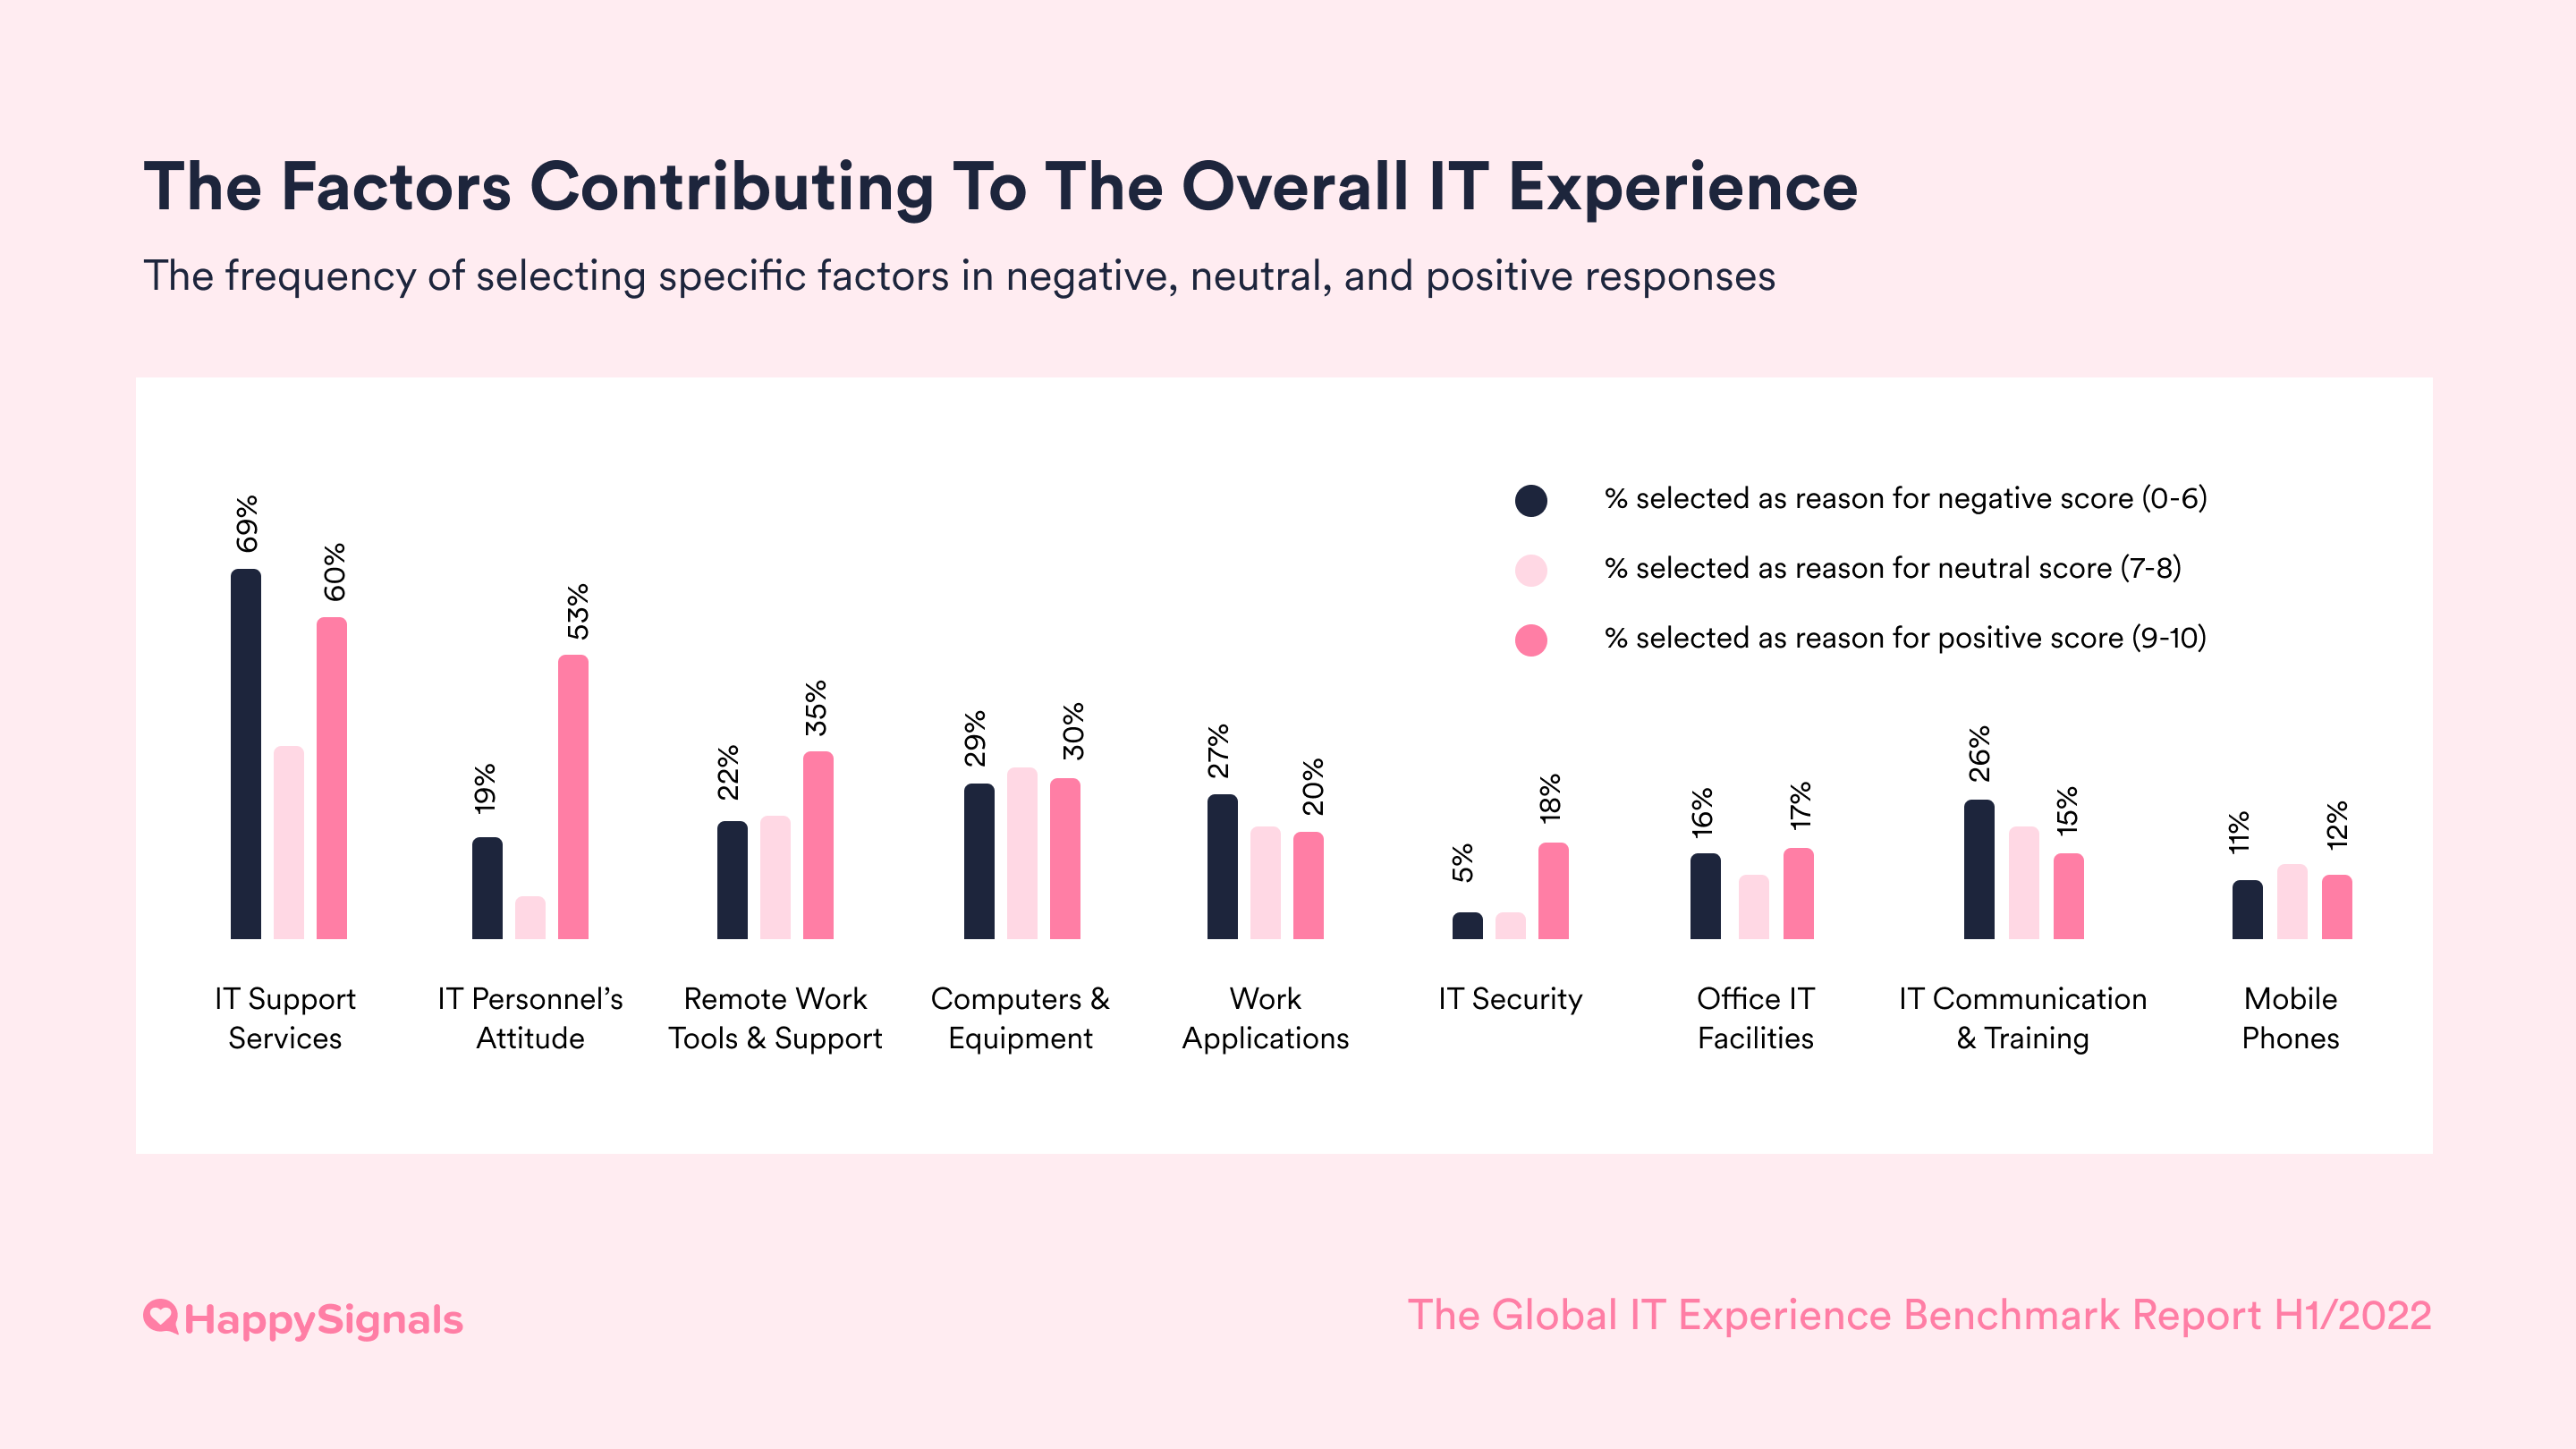
What is the business impact of ITXM on Overall IT Experience?

One of the common mistakes is assuming which IT touchpoints make IT end-users happy. However, new customers are often surprised by the touchpoints that are highly rated by their end-users. Contrary to popular belief, IT services are frequently among the most highly rated IT areas.

If the goal is to enhance the overall employee experience with digital technologies, it's crucial to be aware of which areas are liked the most and the least.

Real-time experience data across different IT touchpoints provides valuable insights that facilitate conversations between IT, HR, and business functions.

Having a comprehensive understanding of the IT experience enables the company to allocate resources based on employee feedback data rather than the gut feelings of leadership team members. This, in turn, leads to a higher success rate in digital transformation projects.


Chapter_2_HSReport

Chapter 2:

Overall IT Experience - The Reputation of IT

This is the first time we have reported on Overall IT Experience. It is not an average of all the measurement areas customers track but a separate one that captures the general perception of IT. It can be useful to see this as the reputation of IT within the enterprise. 

 
This measurement area is our continuous measurement alternative to annual IT surveys to capture how people feel about IT in general and how much time end-users perceive losing in a month due to IT.  Once the end-users give their score between 0-10, they are prompted to select which areas of IT contributed to giving that score.

The image below represent the areas that end-users selected as contributing factors for giving their scores.  IT Support Services is at the top of the list in all three scenarios. 
 
SK-EDIT-H22022-Global IT Experience Benchmark_Webinar Presentation
 
Understanding what contributes to the Overall IT Experience for end-users can be done by looking at how often certain factors are selected in negative, neutral, and positive experiences.
 
These results indicate that when end-users are asked why they are happy or unhappy, IT support services have the biggest impact on their overall IT experience. 
 
If certain factors are seen with positive responses, but hardly ever with negative ones, it would suggest that that aspect of Overall IT Experience is important for good experience but not so crucial for a bad experience.


Overall IT Experience factors 2022-b


Positive Scores

  • As expected, human connection is very important. End-users most frequently selected IT Support Services (60%)and IT Personnel’s Attitude (53%) as contributing factors to their overall IT Experience. Good service is appreciated, and end-users give recognition for it as well. 
  • Remote Work Tools and Support are right behind the support-specific factors. This is logical, especially considering how much our customers have improved their remote work experience over the last two years.  
  • Hardware and software could be something people expect to work without paying attention to them as long as they do. It still matters as around 30% choose Computers & Equipment as a contributing factor in all three feedback categories: negative, neutral, and positive. 
  • Its somewhat surprising to see IT Security being selected by 18% of respondents, but that could result from recognizing the importance of IT security - but being happy someone else takes care of it. 

Negative Scores

  • IT Support Services are at the top of the list, with 69% of respondents giving it as a contributing factor to the poor score.
  • Computers and Equipment are selected as a factor for poor scoring in 29% of responses, the second highest factor chosen in negative (and neutral) scores. 
  • IT Communication and Training are mentioned almost twice as often (26%) in conjunction with negative scores as with positive scores (15%). 
  • Only 5% mention IT Security as contributing to a negative Overall IT Experience. This was somewhat of a surprise to us, as more stringent security often makes end-users go through additional safety measures related to IT, which could harm the experience. 


Chapter_3_HSReport

Chapter 3:

Geographical differences in IT Experience?

3.1 Happiness with incident resolutions in different regions

Like in previous reports, we observe cultural differences in how end-users perceive IT services and lost time. For example, end-users in Western Europe rate their happiness with resolved incidents lower than Eastern Europe, despite reporting less lost time. 
 
In this report, we did additional work with the data quality to eliminate the unwanted impact on the average score of high response volumes in certain countries.

Findings for regional differences for experience with incident resolutions

  • Western European end-users are still the most critical (+72) despite losing less time (2h41min) than in other regions.
    • The least happy country in Europe (and the world) is the Netherlands, followed by Belgium and Germany.
  • South American end-users are the happiest (+89) despite losing more time than in all other regions except Africa. 
  • The spread of the happiness score between regions is higher with incidents than with requests. 


2022-Indidents-Regions


line

3.2 Happiness with fulfilled requests in different regions


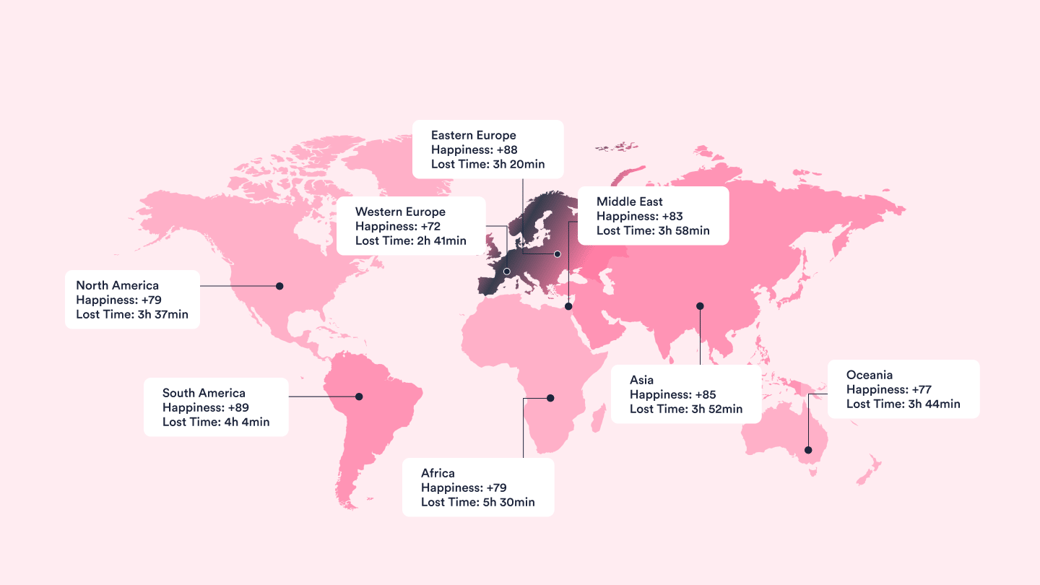
Differences between regional differences for incidents and requests

We observe interesting regional differences between how the numbers vary between incident and request Happiness and Lost Time. 

These numbers appear to suggest that Western European end-users are more demanding in handling incidents, but North American end-users have higher expectations for requests. 
We’ll continue to track these numbers and report more in-depth in future reports. 

Findings for regional differences for experience with resolved requests

  • North American end-users are the least happy with requests and report losing over twice as much time as end-users in Western Europe.
    • End-users from the United states are significantly happier with requests than Canadien end-users, even if Canadien end-users report losing less time.  
  • The spread in happiness scores across regions is lower with requests than with incidents, but the perceived lost time varies much more across geographies.
  • Western European and African end-users are at very similar levels of happiness, despite African end-users reporting losing more than 4x as much time with IT requests. 

2022-Requests-Regions

Key insights

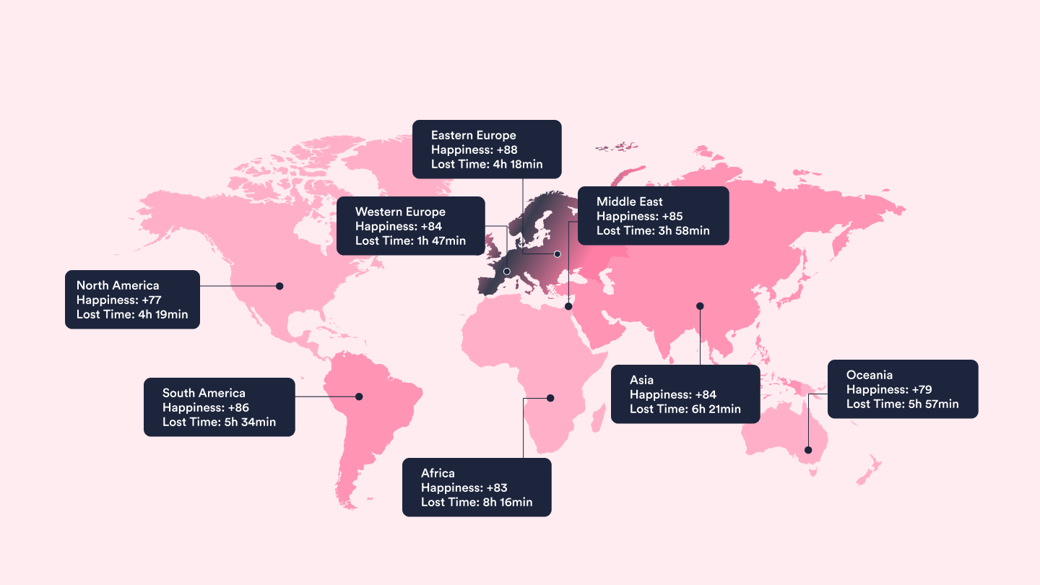
Different cultures perceive and evaluate IT services in different ways. A specific score in one region is not directly comparable to the same specific score in another region. Having comparable benchmark data helps set expectations and provides an external angle for better understanding of end-user experience. 


 How to use this information in practice?

IT service desk leaders can compare the scores to the country benchmark data to choose which countries to focus on. Using the comparison to benchmark data (in addition to internal averages) can help avoid pushing agents towards unachievable goals, or reversely avoid getting too comfortable in regions where higher scores are culturally more common.  


Chapter_4_HSReport

Chapter 4:

IT Experience Management Maturity

We first asked our customers about their ITXM maturity at the end of 2020. This was the year when experience management had ‘a moment’, and employee-centricity became a frequently discussed topic across different enterprise functions.
 
This is the state of ITXM Maturity in January 2023 among HappySignals customers. 
 
Here is how the data was gathered and the profile of the respondents: 
 
  • Respondents are enterprise IT employees
  • None of the respondents work in companies providing outsourced IT services
  • 60% of the companies represented have outsourced their first-line service desk
  • Respondents are working in roles with varying levels of seniority
  • Industries represented contain both private companies and the public sector across North America, Europe, and Oceania. 

Self-assessed maturity with IT Experience Management

Slide9


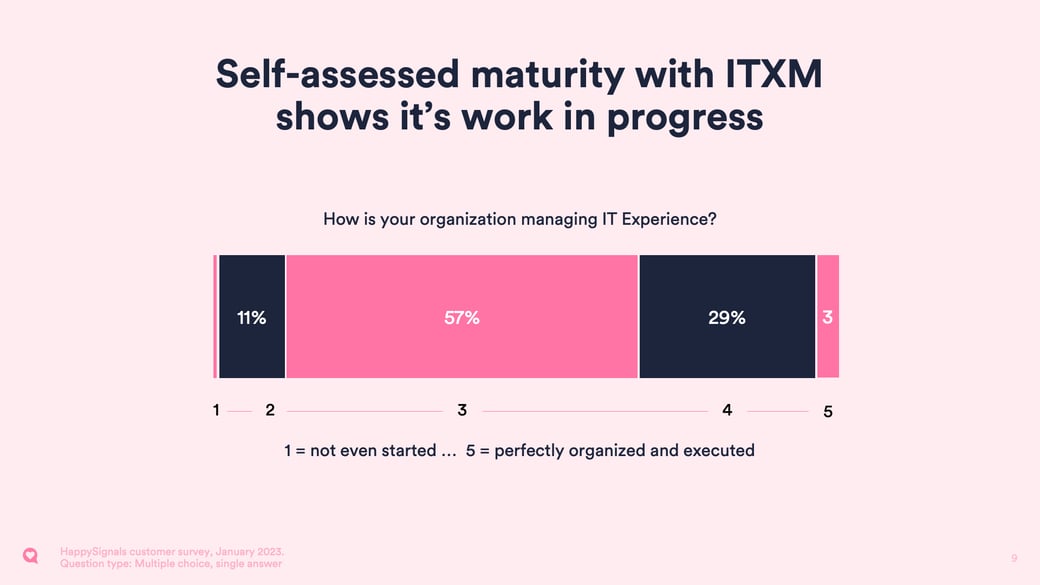
Most respondents felt their organization is still on the journey towards being perfectly organized and executed. This is expected as ITXM practices are still new and often require changing previously established practices and processes. 

How important is ITXM for IT leadership? 

Slide10

Just like in 2020, respondents from companies with an outsourced first-line service desk were more likely to perceive IT leadership as clearly having experience as the primary target for internal services. 
 
This could be explained by experience being more likely to be a key KPI when external service providers are responsible for the first-line service desk. 
 

Experience targets for different parts of IT

Slide11

Among HappySignals customers, 100% use Experience Management for their service desks. Therefore, it’s unsurprising to see Service Desk Teams being the most common part of IT to have Experience targets. 
 
Notably, Service Owners in 46% of cases also have experience targets. This is an excellent step in the right direction, as it means experience starts to guide work beyond the service desk context. 
 

IT KPIs are still mostly created by IT itself 

Slide13

While IT is getting better at focusing on value for the business, the way good work in the service desk is measured is still very much defined by IT itself. 
 
This is unfortunate, as our research shows results would be faster to improve if IT set KPIs together with business stakeholders. 
 
Introducing Experience Management Offices could positively impact this, as more stakeholders are participating in decision-making regarding IT experience management. 

XMOs are coming, but its work in progress

Slide12

Only 4% of respondents said they had established an XMO. This result is unsurprising as the term was only coined in the last 12 months. 
 
29% of organizations planning on setting up an XMO is very encouraging. We’re hoping to see this number climb as the awareness around experience attracts new stakeholders, and best practices are being adopted across organizations. 

Sanctions are being dropped in favor of more neutral collaboration models

Slide14

This was a surprising result. We expected that rewards would be more common than two years ago - which is the case - but the most significant change has happened in how sanctions are becoming rarer and rarer. 
 
The share of organizations with neither rewards nor sanctions has increased by more than 4x. Only 9% of respondents had neither in 2020, while the percentage jumped to 38% in 2023. 
 
We’ve long been advocating for relationships based on trust and transparency between enterprises and outsourced service providers. These results confirm a fundamental change in how sanctions are left out in favor of other governance methods. 

Sharing experience data with stakeholders

Slide15

Sharing experience data is crucial for creating awareness and buy-in for IT Experience Management in the organization. A smaller group of people often drives the decision to become invested in improving the IT experience. 
 
  • 61% indicate that they regularly create reports of IT Experience
  • 46% have regular Experience reviews in IT
    • Internal Experience reviews in IT
    • Reviews with non-IT stakeholders
    • Reviews with partners and service providers
  • 39% export IT Experience data to other tools. We know from customers these include:
    • Correlating Experience data to process and technology data
    • Including IT Experience data in other reports to business stakeholders
    • Using Experience data to create more in-depth storytelling in presentations and internal reports.
  • 36% share data on info screens in offices or online.
 
These practices help create a shared understanding of IT Experience and facilitate data-informed decisions. As Experience Management practices become established and ingrained, growth in these areas is expected.

Recognizing improvement areas and communicating successes

SK-EDIT-H22022-Global IT Experience Benchmark_Webinar Presentation-1

89% of our customers recognize development areas by using experience data. While that number is high, the systematic approach to finding improvement areas is something a large majority knows they could improve. 
 
The challenge is often changing IT culture to be more experience-centric. Changing attitudes, habits, and unspoken rules in large organizations is challenging. 
 
It’s a journey that often takes time, but seeing almost 90% using the data for identifying development areas is very positive indeed. 
 
Identifying development areas leads to allocating resources where fixes can be made. Communicating to end-users about improvements is an essential part of IT Experience Management. Efficient communication to end-users that shows feedback on IT matters is critical to avoiding survey fatigue among end-users. 
 
71% of HappySignals customers sometimes communicate about experience-related fixes, while 18% have a model for continuous communication. 
 
Knowing how closely linked to Experience Management success communication is, this is another area where we expect to see higher numbers of enterprises establishing clear models and practices in the future.
Slide17


Using IT Experience data for decision making?

Slide18

The top results, in which context IT Experience data is used for decision making, were not a surprise. All of HappySignals' customers use the platform with their service desk. It's therefore not surprising to see 96% indicating that Experience data is used for service desk improvement initiatives. 
 
The knowledge base is the second highest area, where 43% say they use Experience data for decisions. Using Experience data to guide creating, updating, or retiring knowledge base articles is closely linked to a good self-service experience. 
 
Earlier in the report, we could see improvements in service portal experience scores. That could, in many cases, be closely linked to experience-centric knowledge base improvements. 
 
What about bigger decisions that have a multi-year impact?
 
Service desk improvement initiatives and knowledge base decisions are close to the operational and tactical level of IT decisions but what about wider strategic choices?
 
In third place, 39% indicate that theyve used IT experience data for decisions related to changing partners or tools. This is followed by 25% indicating they've used IT experience data for IT partner selection or retention. 
 
Those are decisions that significantly impact IT services, but also areas where the provided experience is in a very central role. 

Biggest benefits of ITXM

Slide19

One thing about IT that remains constant regardless of how processes and technology change is the importance of providing an excellent experience for end-users. That's a common goal that everyone in IT can agree upon, regardless of their role or responsibility. 
 
The main goal of Experience Management is to improve the experience of end-users. This is why it's unsurprising that 89% of companies feel happier end-users are a key benefit of Experience Management. 
 
Internal benefits for IT teams
 
A better employee experience leads to a better customer experience. Different business leaders have said this statement over the last few years, and the same appears to apply to IT Experience. 
 
IT often refers to the end-users as their internal customers. Therefore it's very satisfying to see that Experience Management leads to more motivated IT employees that can make better decisions with better focus. 
 
  • 64% say Experience Management has brought better focus to IT teams
  • 64% say IT can make better decisions based on data
  • 64% also say they see more motivated IT employees
 
Proving value of IT Experience Management
 
More than half of the people surveyed (57% of respondents) believe that demonstrating the value of IT to the business is one of the most significant advantages. This is because the relationship between the IT department and the business stakeholders hasn't always been smooth sailing, with disagreements over priorities being common. One way to improve this relationship is by concentrating on enhancing end-users experience with IT services and by having data that shows when improvements have been made.
 
Improved relationship with IT partners
 
55% of the respondents believed that their partnership with their IT vendors had improved through Experience Management.
 
This finding is particularly significant because the "Watermelon Effect" is commonly seen with outsourced partners. This effect occurs when IT metrics appear positive on the surface (green), but in reality, the end-users experience is poor (red). Using experience data to improve the outcomes and relationships with partners remains one of the most common use cases among our customers. 
 
Chapter_4_HSReport

Chapter 5

IT Service Desk Benchmarks - incidents and requests


The HappySignals Benchmark report has consistently included benchmark data for ticket-based services provided by service desks. While the current report contains updated figures, we have allocated less time to analyze the results. For a more detailed analysis, we suggest downloading the previous report.

Our method for measuring end-user experience with Ticket-based IT (Incidents and Requests) involves sending surveys to end-users after each ticket resolution using HappySignals. These surveys ask end-users to provide feedback on their experience and cover the following metrics:

Happiness: End-users rate how happy they are with their recent service experience on a scale from 0-10. HappySignals then calculates % of 9-10 scores - % of 0-6 scores = Overall Happiness (a number between -100 to 100).
 
Productivity: End-users estimate how much work time they lost due to the service experience.
 
Factors: End-users select from a list of suggested reasons – which we call Factors – that influenced their Happiness rating: e.g. “Service was slow”, “My ticket was not solved”. Multiple factors can be selected.

line

5.1 Happiness for IT Incident resolutions has remained stable in 2022

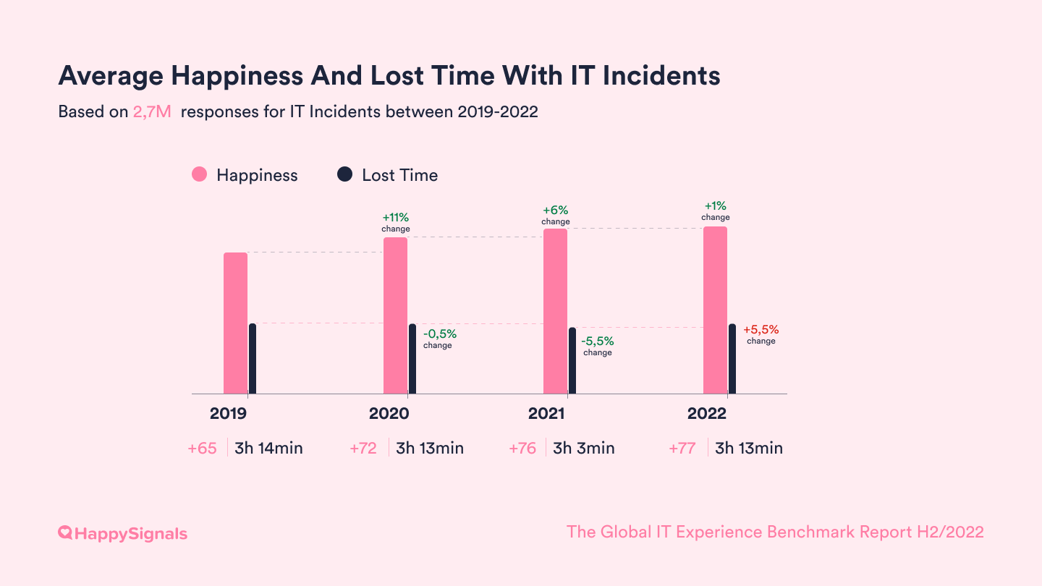
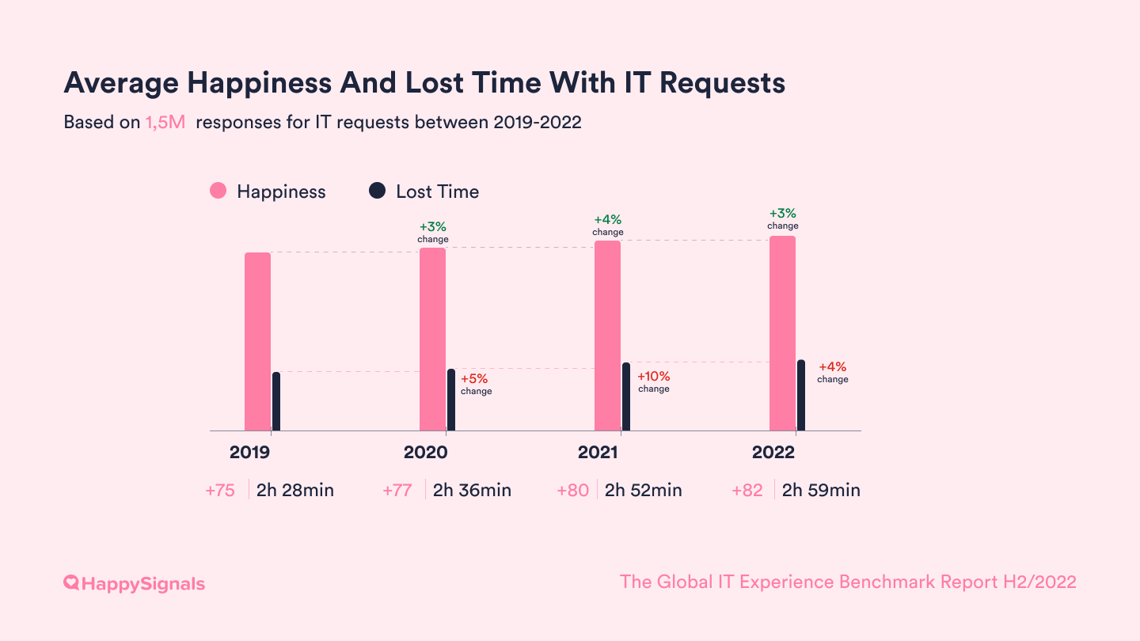
The upward trend over several years with IT incident resolutions happiness has stabilized. Lost time with IT incidents is slightly oscillating but al in all, the changes in 2022 were minor. 


2022-02-Incidents_Lost_Time_Happiness

The 13/80 rule means 80% of lost time with IT incidents comes from only 13% of tickets. 

The data below was first reported in the H1/2022 Benchmark report, but is still very relevant. The section below is identical to the previous report. 

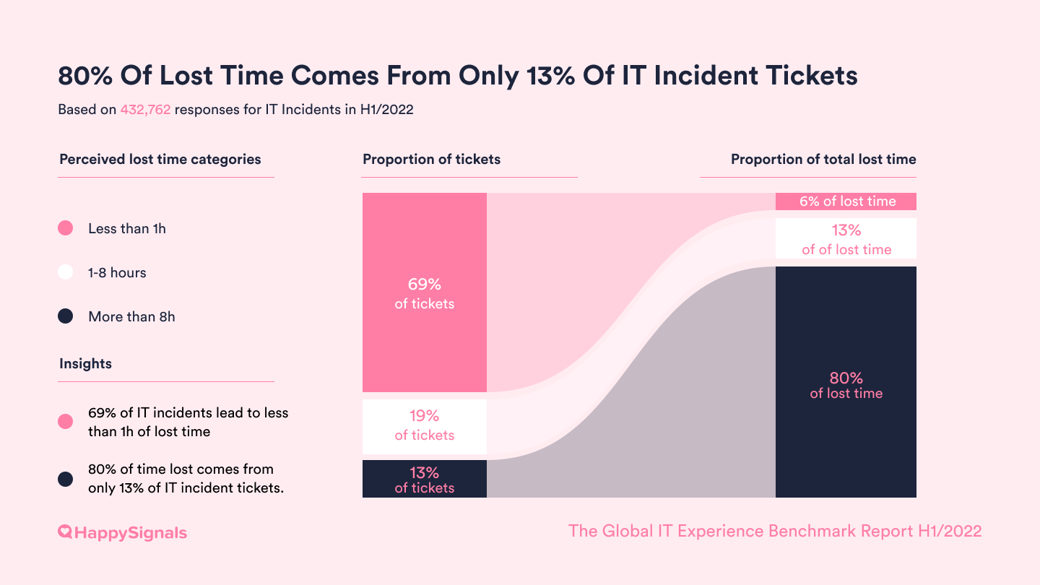
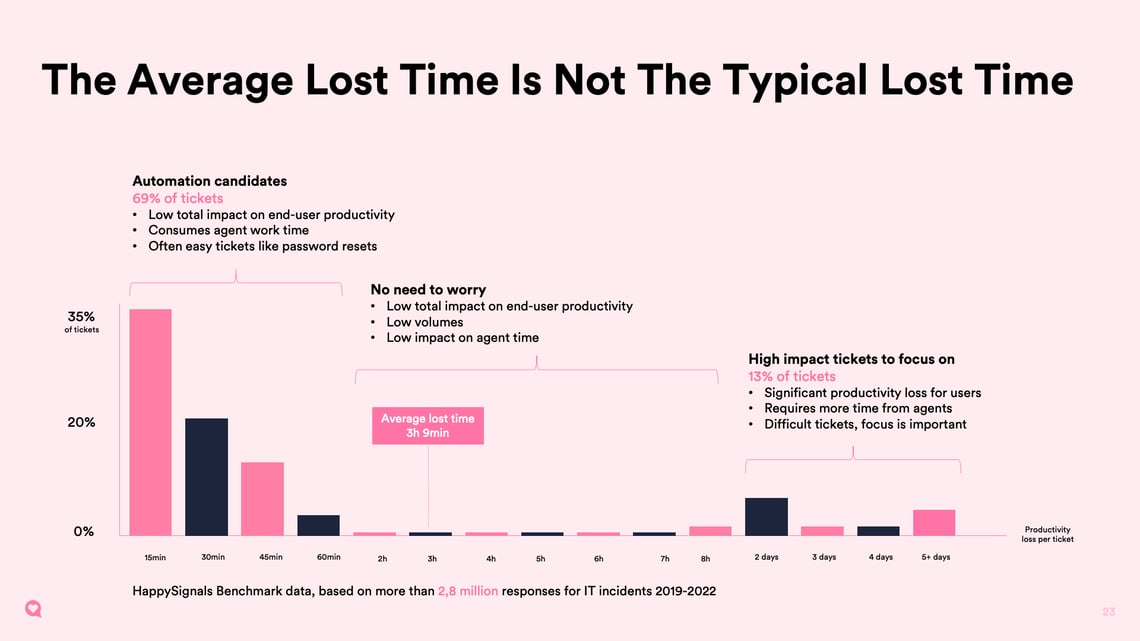
Looking more closely at lost time across all incidents, we can see that the distribution of perceived lost time is unevenly represented on both sides of the spectrum. The historical trend shows how this polarization of the speed of service means that tickets solved in under 8 hours are solved even faster year after year, but tickets that lead to more than 8 hours of lost time take even longer. 

This explains the paradox of rising average lost times in the last two reports. Most end-users are receiving faster IT support with IT incidents, but those that do not have to wait an increasingly long time. This leads to average lost time going up due to the even longer waiting times for the tickets that lead to more than 8 hours of perceived lost time. 


2022-02-80-percent-lost-time-from-12-percent-of-tickets-sanker


Slide23-Update


line

5.2 Factors: The ‘Why’ behind end-user happiness or unhappiness

Understanding the reasons behind end-users' dissatisfaction with ticket-based IT services is crucial for improving them, and the HappySignals IT Experience Management Platform excels in identifying these factors.


Slide21


Using a standardized list of Factors developed from research with IT end-users, we ask end-users to select the factors that best reflect their satisfaction or dissatisfaction with the service in a survey sent to them after a ticket resolution. The timing of the survey delivery is optimized to assess end-users' feelings about the service at the moment of their experience, making our Factors data more reliable.

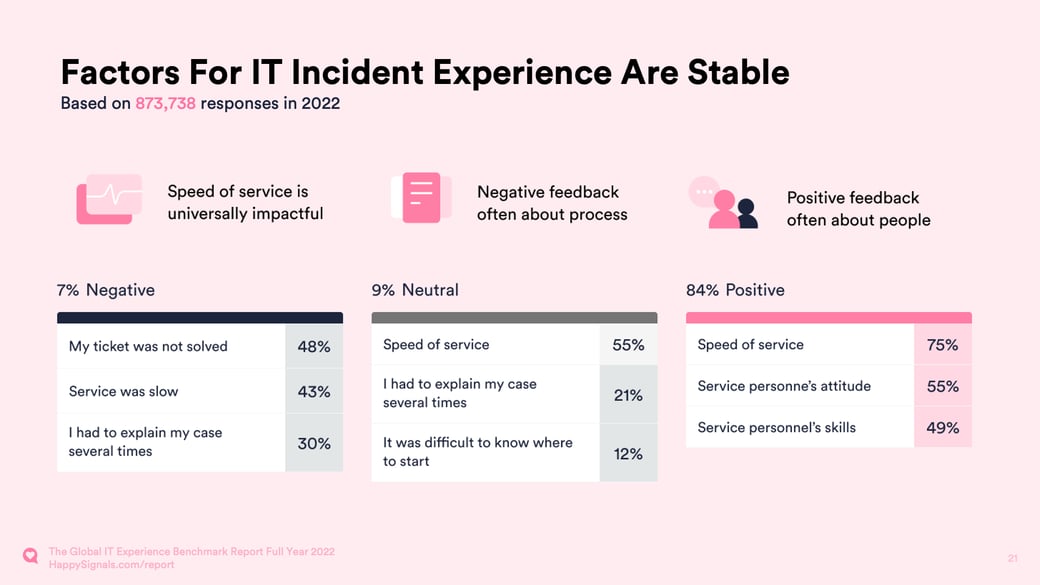
Different factors are presented to end-users depending on their happiness rating on a 10-point scale, and they can select as many factors as they wish from the list. Factors related to service agents are included in all three scenarios of negative (0-6), neutral (7-8), and positive (9-10) experiences. For example, for IT incidents, 75% of responders who gave a positive happiness rating and selected at least one factor were happy about the speed of service.

End-users can select multiple factors, thus making the percentages add up to more than 100%. By monitoring and analyzing these factors, IT organizations can gain valuable insights into end-user satisfaction and identify areas for improvement in their ticket-based services.

Historical data on Factors for IT Incidents

The factors that create positive, neutral and negative experiences with IT Incidents for end-users remain very stable.

 
IT Incidents - Positive Factors 2019 2020 2021 H1/2022
Speed of service 75% 74% 74% 75%
Service personnel's attitude 52% 55% 56% 55%
Service personnel's skills 48% 49% 50% 49%
Service was provided proactively 28% 34% 36% 37%
I was informed about the progress 29% 33% 35% 35%
I learned something 21% 25% 26% 26%
 
 
IT Incidents - Neutral Factors 2019 2020 2021 2022
Speed of service 58% 57% 55% 55%
I had to explain my case several times 20% 21% 21% 21%
It was difficult to know where to start 11% 11% 12% 12%
I wasn't informed about the progress 11% 11% 10% 10%
Service personnel's skills 10% 8% 8% 8%
Instructions were hard to understand 7% 7% 8% 8%
Service personnel's attitude 7% 6% 7% 7%
 
 
IT Incidents - Negative Factors 2019 2020 2021 2022
 My ticket was not solved 40% 46% 47% 49%
Service was slow 47% 44% 44% 43%
I had to explain my case several times 29% 30% 29% 30%
I wasn't informed about the progress 16% 16% 16% 16%
Service personnel's skills 12% 12% 12% 12%
Instructions were hard to understand 7% 8% 8% 8%
It was difficult to know where to start 7% 7% 7% 7%
Service personnel's attitude 6% 7% 7% 7%


5.3 IT Support Channels


In service delivery, IT teams must also concentrate on developing channels to enhance end-user satisfaction. To create channels that improve employee happiness, it's essential to begin by obtaining reliable and detailed experience data about how different channels are utilized and perceived by end-users.

Without acquiring and utilizing this data, IT teams may mistakenly allocate resources to add new channels unnecessarily or encourage end-users to use them, or focus on improving channels that are already performing well instead of those that require attention. 

Usage of different channels for IT Incidents

Our channel usage data reflects the recent trend in the ITSM industry of developing channels with automation and predefined user flows to reduce the workload on service desk agents. This trend is expected to continue as IT organizations strive to improve efficiency while enhancing the overall customer experience. Investments in service portals, smart AI-powered chats, and proactive monitoring of services with self-healing capabilities all aim to optimize the use of technology across different teams.

However, we advise against losing sight of end-user needs by continuously monitoring how their experience changes when support channel recommendations and usage are modified. If possible, establish a baseline for experience data before the change, track changes during the transition, and draw conclusions by assessing the experience a few months after implementation.

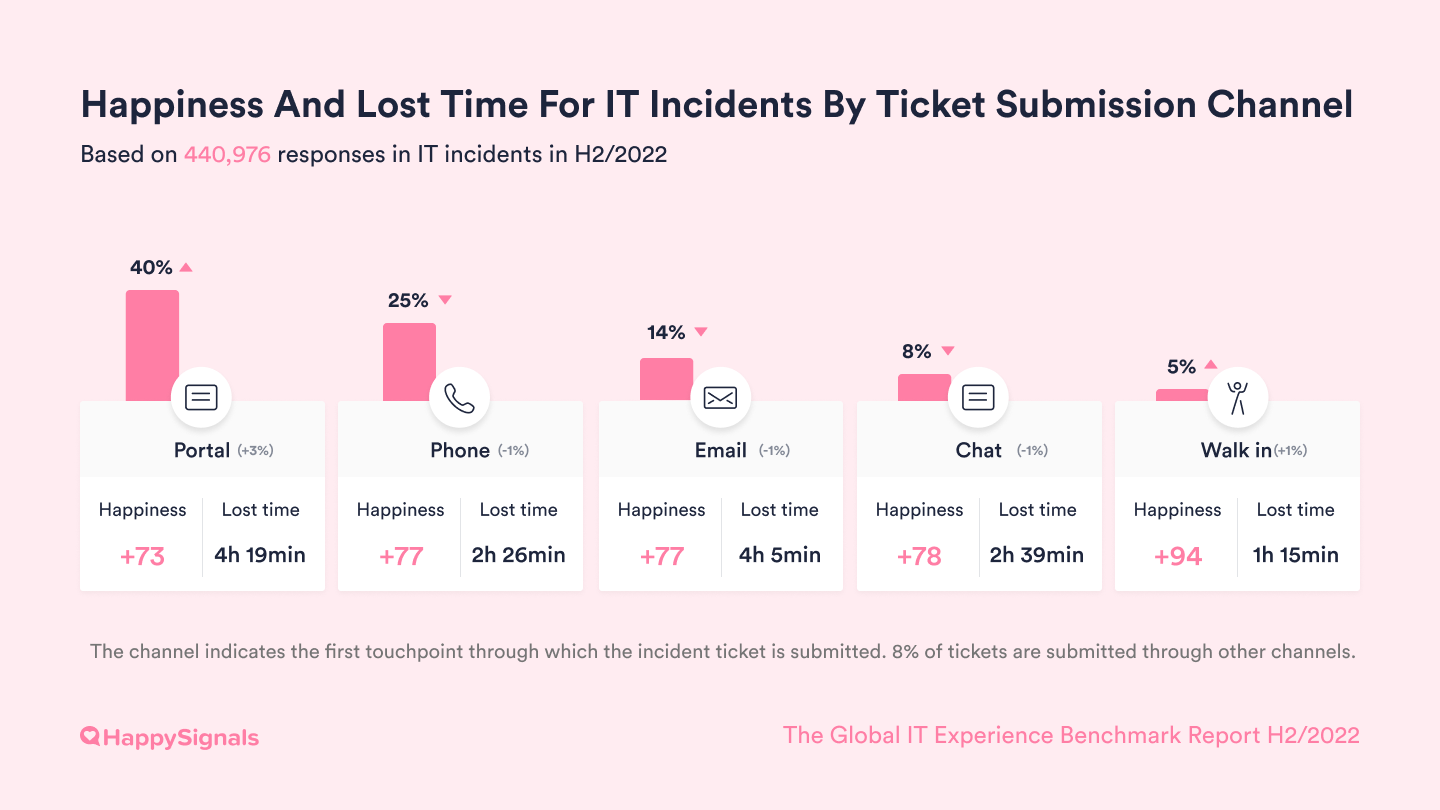
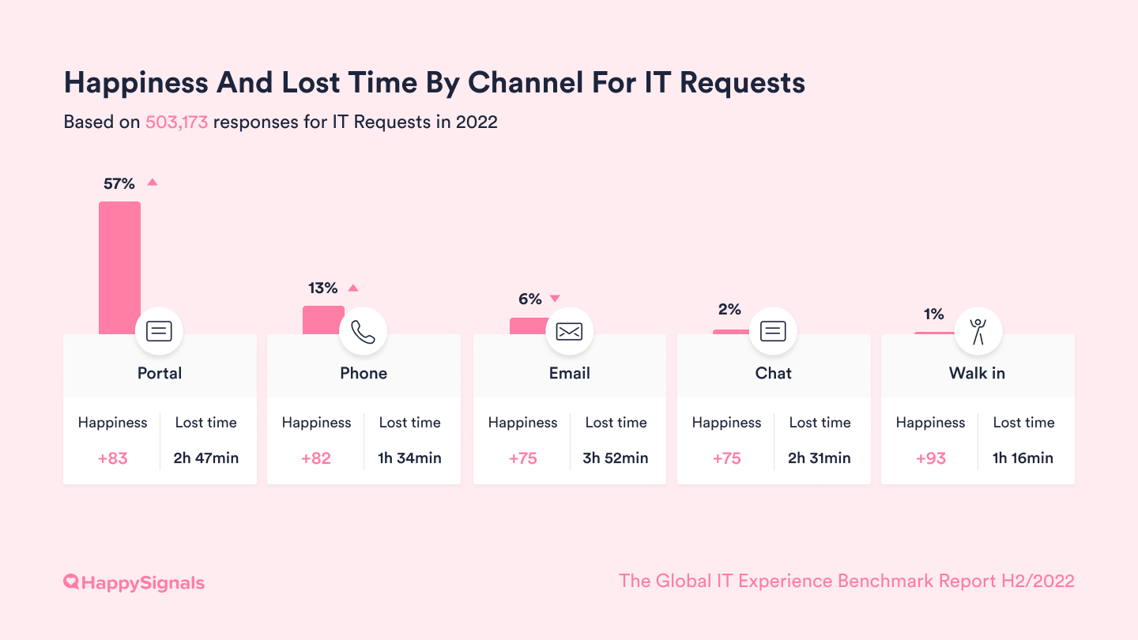
Note that the total percentages do not add up to 100% because we exclude channel categories that cannot be accurately categorized into the existing five categories.

Focus your resources on improving existing channels, not adding new ones

Based on the data from all our customers, there are only slight differences in overall happiness with the digital channels – Chat, Email, Phone, and Portal (all range from +73 to +78). The only channel with significantly higher happiness is Walk-in (+94). The perception of lost time is also by far the lowest for Walk-in IT support, with just 1h 15min on average per incident, 1h 11min less than the second least time-consuming channel, Phone.

For the first time, in H2/2022, more incidents were submitted through service portals than email and phone combined.


2022-06-Channel_usage_Incidents


Historical data, year-on-year changes in which channel the incident ticket is raised.


Channel usage for IT Incidents 2019 2020 2021 2022
Chat 8% 9% 9% 9%
Email 19% 17% 15% 15%
Phone 30% 30% 27% 25%
Portal 33% 33% 38% 39%
Walk in 6% 3% 3% 4%
Other 4% 8% 8% 8%


line

5.4 Ticket reassignments impact end-user happiness and productivity significantly

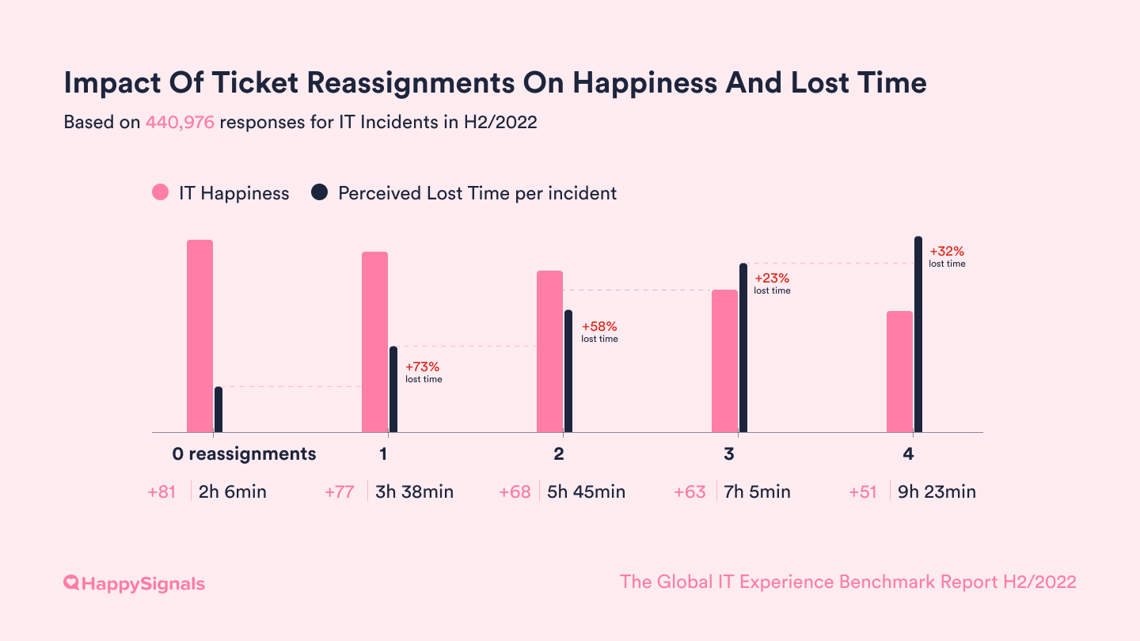
Each time a ticket is reassigned, end-user happiness decreases by nearly 8 points, and users lose an average of 1 hour and 49 minutes of work time, ranging from 0 to 4 reassignments. When a ticket is reassigned four times, it can result in a total loss of 9 hours and 23 minutes!

Our data, collected over the past four years, has shown consistent trends in the frequency of ticket reassignments and the corresponding impact on end-user happiness and lost time. These trends have remained relatively stable, with only minor variations, indicating that they are a reliable and consistent indicator of the impact of ticket reassignments on end-user satisfaction and productivity.


Reassignments-IT-incidents-H2-22

What is the business impact of ITXM on ticket reassignments?

Understanding and improving ticket reassignments is crucial for IT to enhance end-user happiness and productivity, making it one of the most significant metrics. Begin by pinpointing the primary causes of ticket reassignments in your company. Determine which ticket types are bounced the most and the underlying reasons for it. Can modifications or automation be implemented to expedite the routing of these tickets to the appropriate agents?

If you want to learn more about minimizing excessive ticket bouncing, refer to this article. Additionally, IT organizations can utilize HappySignals data on reassignments to create concrete business cases that demonstrate the potential productivity benefits that can be attained by implementing data-driven improvements aimed at reducing ticket reassignments.


line5.5 Different Support Profiles have different service expectations

While we've covered the experiences of IT end-users in previous sections, it's important to note that there are also differences in behavior and motivation among them. Knowing these differences can help tailor IT services for different types of end-users.

This is where HappySignals IT Support Profiles can be useful.

We conducted interviews with over 500 end-users and found that two main behavioral drivers, Competence and Attitude, have the greatest impact on end-user behavior and experience. Competence refers to the end-user's capability to fix IT problems independently, while Attitude pertains to their willingness to solve the problem independently.

By mapping these behavioral drivers, we defined four Support Profiles: Doer, Prioritizer, Trier, and Supported. For more information on using these profiles in the IT Service Desk, refer to our Guide.

Doers are still the most critical, Supported remain the easiest to please

Consistent with previous years, Doers again have the lowest Happiness of +73, while Supported are still the happiest with Happiness of +84.


2022-02-Support Profiles


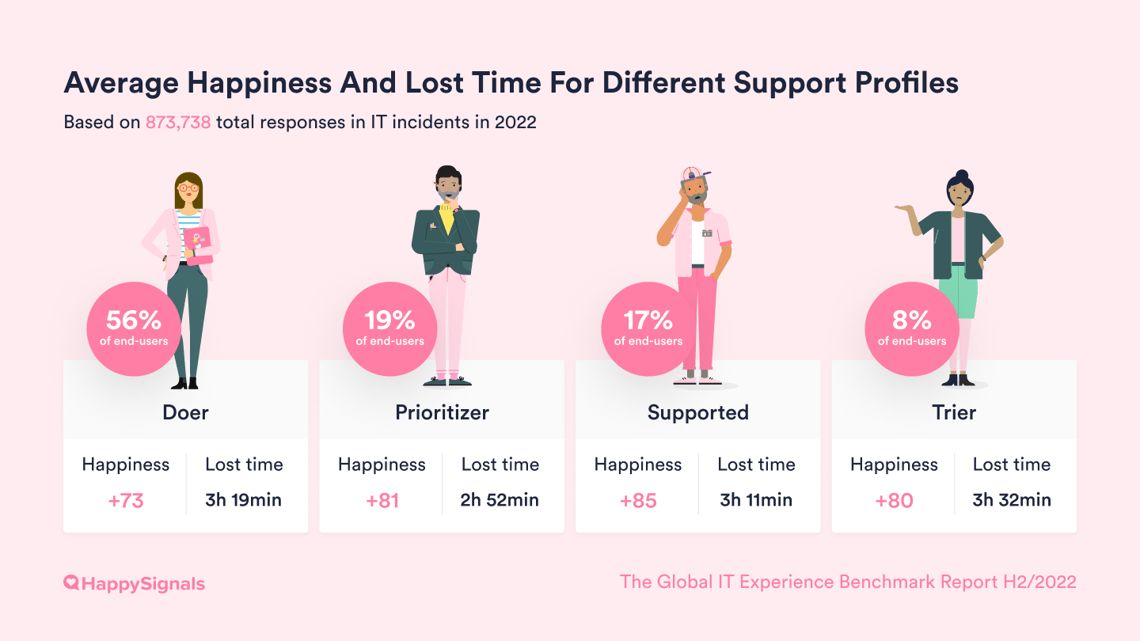
We have several hypotheses as to why these patterns have remained stable. One possible explanation is that the Doers, who are both competent and motivated to solve IT problems themselves, are likely to only raise tickets when faced with complex issues. These types of problems are typically more challenging for service agents to resolve quickly, making it difficult to achieve high experience scores with Doers. Additionally, as technically skilled end-users, they may have higher expectations for service quality and speed.

On the other hand, the Supported group is neither competent nor motivated to solve IT problems independently and are simply seeking assistance. They may be less demanding of IT services, resulting in higher satisfaction ratings on average. They may also submit tickets even for simple issues, which are easier for agents to resolve, leading to smoother service experiences.

Does each Support Profile prefer different support channels?

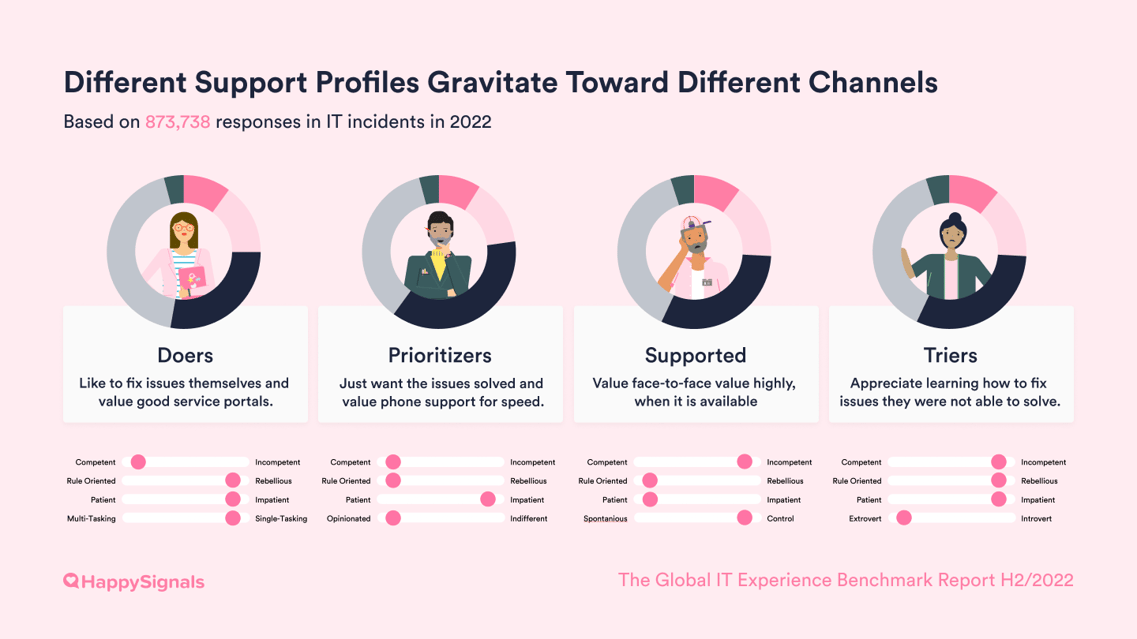
Observing the way different support profiles utilize various channels confirms the behavioral drivers identified in our original research about IT Support Profiles. The data on IT incident channel usage by different profiles reveals the following patterns:

Self-service portals are the preferred channel for Doers, who enjoy solving issues themselves, and they are least likely to use the Phone.

Prioritizers, who prefer minimal participation in issue resolution, use the Phone more frequently than other support profiles.

Supported and Triers use Walk-in IT support 30-35% more often than Doers and Prioritizers, reflecting their preference for personal assistance and learning from patient service personnel.

For further information on how to customize services to better serve different end-users in the organization, we suggest downloading our Definitive Guide on IT Support Profiles.

2022-10-Support Profiles


What is the business impact of understanding end-user IT Support Profiles?

Although you can't change your end-users, you can customize your IT services to suit various support profiles. One way to do this is by adjusting how service agents communicate with each profile when they reach out to the service desk. For instance, Doers and Prioritizers may prefer technical jargon, while Supported and Triers may benefit from simple language and step-by-step instructions.

Another approach is to analyze the data by profiles to identify which channels work best for different profiles. Then, you can develop and promote these channels to the relevant end-user profile groups.

To learn more about using support profiles to enhance ticket-based services, check out our comprehensive guide!


line

5.6 A brief look at IT Requests

Key insights

  • End-user Happiness has continued to increase every year, but so has the lost time with requests as well

2022-02-Requests_Lost_Time_Happiness

5.7 IT Request channel distribution


  • The trend continues and, lost time is higher for IT Requests in Email than Portal.
    • Happiness with requests submitted via Portal has steadily improved, while lost time with requests submitted via Email has gotten worse.
    • The increase in lost time through Email is also reflected in lower end-user happiness.


2022-12-Channel usage for IT Requests


  • New channels are being used
    • In the last six months, over 20% of IT Requests have been submitted through channels that are not reflected in our benchmark data. These have been categorized as “Other”.
    • These “Other” channels are mostly a matter of non-standard configurations in the ITSM tools, but also new more experimental support channels. 

Analyzing Request Ticket Channels: Yearly Changes in Historical Data


Channel usage for IT Incidents 2019 2020 2021 2022
Chat 1% 2% 3% 2%
Email 8% 8% 9% 6%
Phone 20% 18% 12% 13%
Portal 63% 54% 57% 57%
Walk in 1% 2% 1% 1%
Other 7% 16% 18% 21%
 

5.8 IT Request factors for happiness

Historical data on Factors for Happiness and Lost Time with IT Requests

The saying “Technology changes, People stay the same” rings true in our data. The Factors that create positive, neutral and negative experiences with IT Requests for end-users remain very stable over the last 4 years. 

The only slight changes have happened in a decrease in selection of service personnel's attitude and skills as factors, which could very well be explained by the increased amount of requests that don't require service personnel to intervene. Instead, requests are increasingly handled in self-service portals.

 
IT Requests - Positive Factors 2019 2020 2021 2022
Speed of service 79% 79% 80% 80%
Service personnel's attitude 49% 48% 47% 45%
Service personnel's skills 46% 46% 45% 44%
I was informed about the progress 31% 34% 36% 34%
It was easy to describe what I wanted 31% 32% 33% 33%
Instructions were easy to understand 29% 31% 32% 32%
 
 
IT Requests - Neutral Factors 2019 2020 2021 2022
Speed of service 58% 57% 58% 56%
I had to explain my case several times 15% 15% 15% 15%
It was difficult to know where to start 12% 11% 12% 11%
I wasn't informed about the progress 11% 12% 11% 11%
It was difficult to describe what I needed 8% 8% 8% 9%
Instructions were hard to understand 8% 8% 7% 8%
Service personnel's skills 7% 6% 6% 7%
Service personnel's attitude 5% 4% 6% 6%
 
 
IT Requests - Negative Factors 2019 2020 2021 2022
Service was slow 55% 57% 56% 55%
I had to explain my case several times 33% 31% 31% 31%
I wasn't informed about the progress 23% 29% 27% 26%
Service personnel's skills 17% 16% 13% 13%
Instructions were hard to understand 12% 12% 11% 12%
It was difficult to know where to start 10% 10% 10% 10%
Service personnel's attitude 8% 9% 8% 8%
It was difficult to describe what I needed 7% 6% 7% 7%


Chapter_5_HSReport

The Final Takeaway

Based on our 2022 research data on ITXM (IT Experience Management), a human-centric approach to experience management can have significant benefits for organizations. Our analysis of this data from different angles presents a holistic snapshot of end-user experiences in enterprise IT. It's worth noting that the data used in this report is solely from HappySignals customers - organizations that have embraced a human-centric approach to experience management.

One of the main benefits of ITXM is its ability to empower enterprise IT leaders to drive data-driven change. By prioritizing the needs and experiences of employees, IT leaders can make informed decisions that improve productivity and overall business outcomes. Additionally, a focus on human-centric experience management can help organizations transform their IT culture, making it more empathetic and responsive to employee needs.

Another key benefit of ITXM is its impact on employee happiness. By prioritizing a positive experience for employees, organizations can improve employee retention rates and reduce turnover costs. Moreover, happy employees are more engaged and productive, which can lead to improved business outcomes.

In conclusion, our 2022 research data on ITXM highlights the importance of a human-centric approach to experience management. By prioritizing employee experiences and focusing on data-driven decision-making, organizations can achieve better outcomes for both employees and the business as a whole.

Continue learning with more resources

Intrigued? Discover experience management by reading the IT Experience Management Framework (ITXM™) Guide. This downloadable 10-page read introduces ITXM™ and how to lead human-centric IT operations with experience as a key outcome.

Do you prefer learning through short video courses? Check out ITXM.academy, where in about 1 hour, you can learn the foundations of IT Experience Management and get certified for free. 

If you enjoyed this report, you may also want to visit our Learning Center for bite-sized videos and blog posts about topics from XLAs to optimizing your ServiceNow.


Download the full report

The Global IT Experience Benchmark Report H2/2022


benchmark_data

Interested in discovering more Benchmark Data? 

Read our previous Global IT Experience Benchmark Reports.

2022:

H1/2022 Report

2021:

H1/2021 Report

H2/2021 Report


Ready to drive IT Experience Management in your organization?

Let's talk!


Book a 30-min meeting to discuss your challenges and how Experience Management can help.

Get in Touch
See how HappySignals Platform works

Watch Demo
HappySignals Platform

Ready to get started?

Contact Sales

Contact Sales