Watch the Webinar
Discover the latest findings from the Global IT Experience Benchmark H1/2022

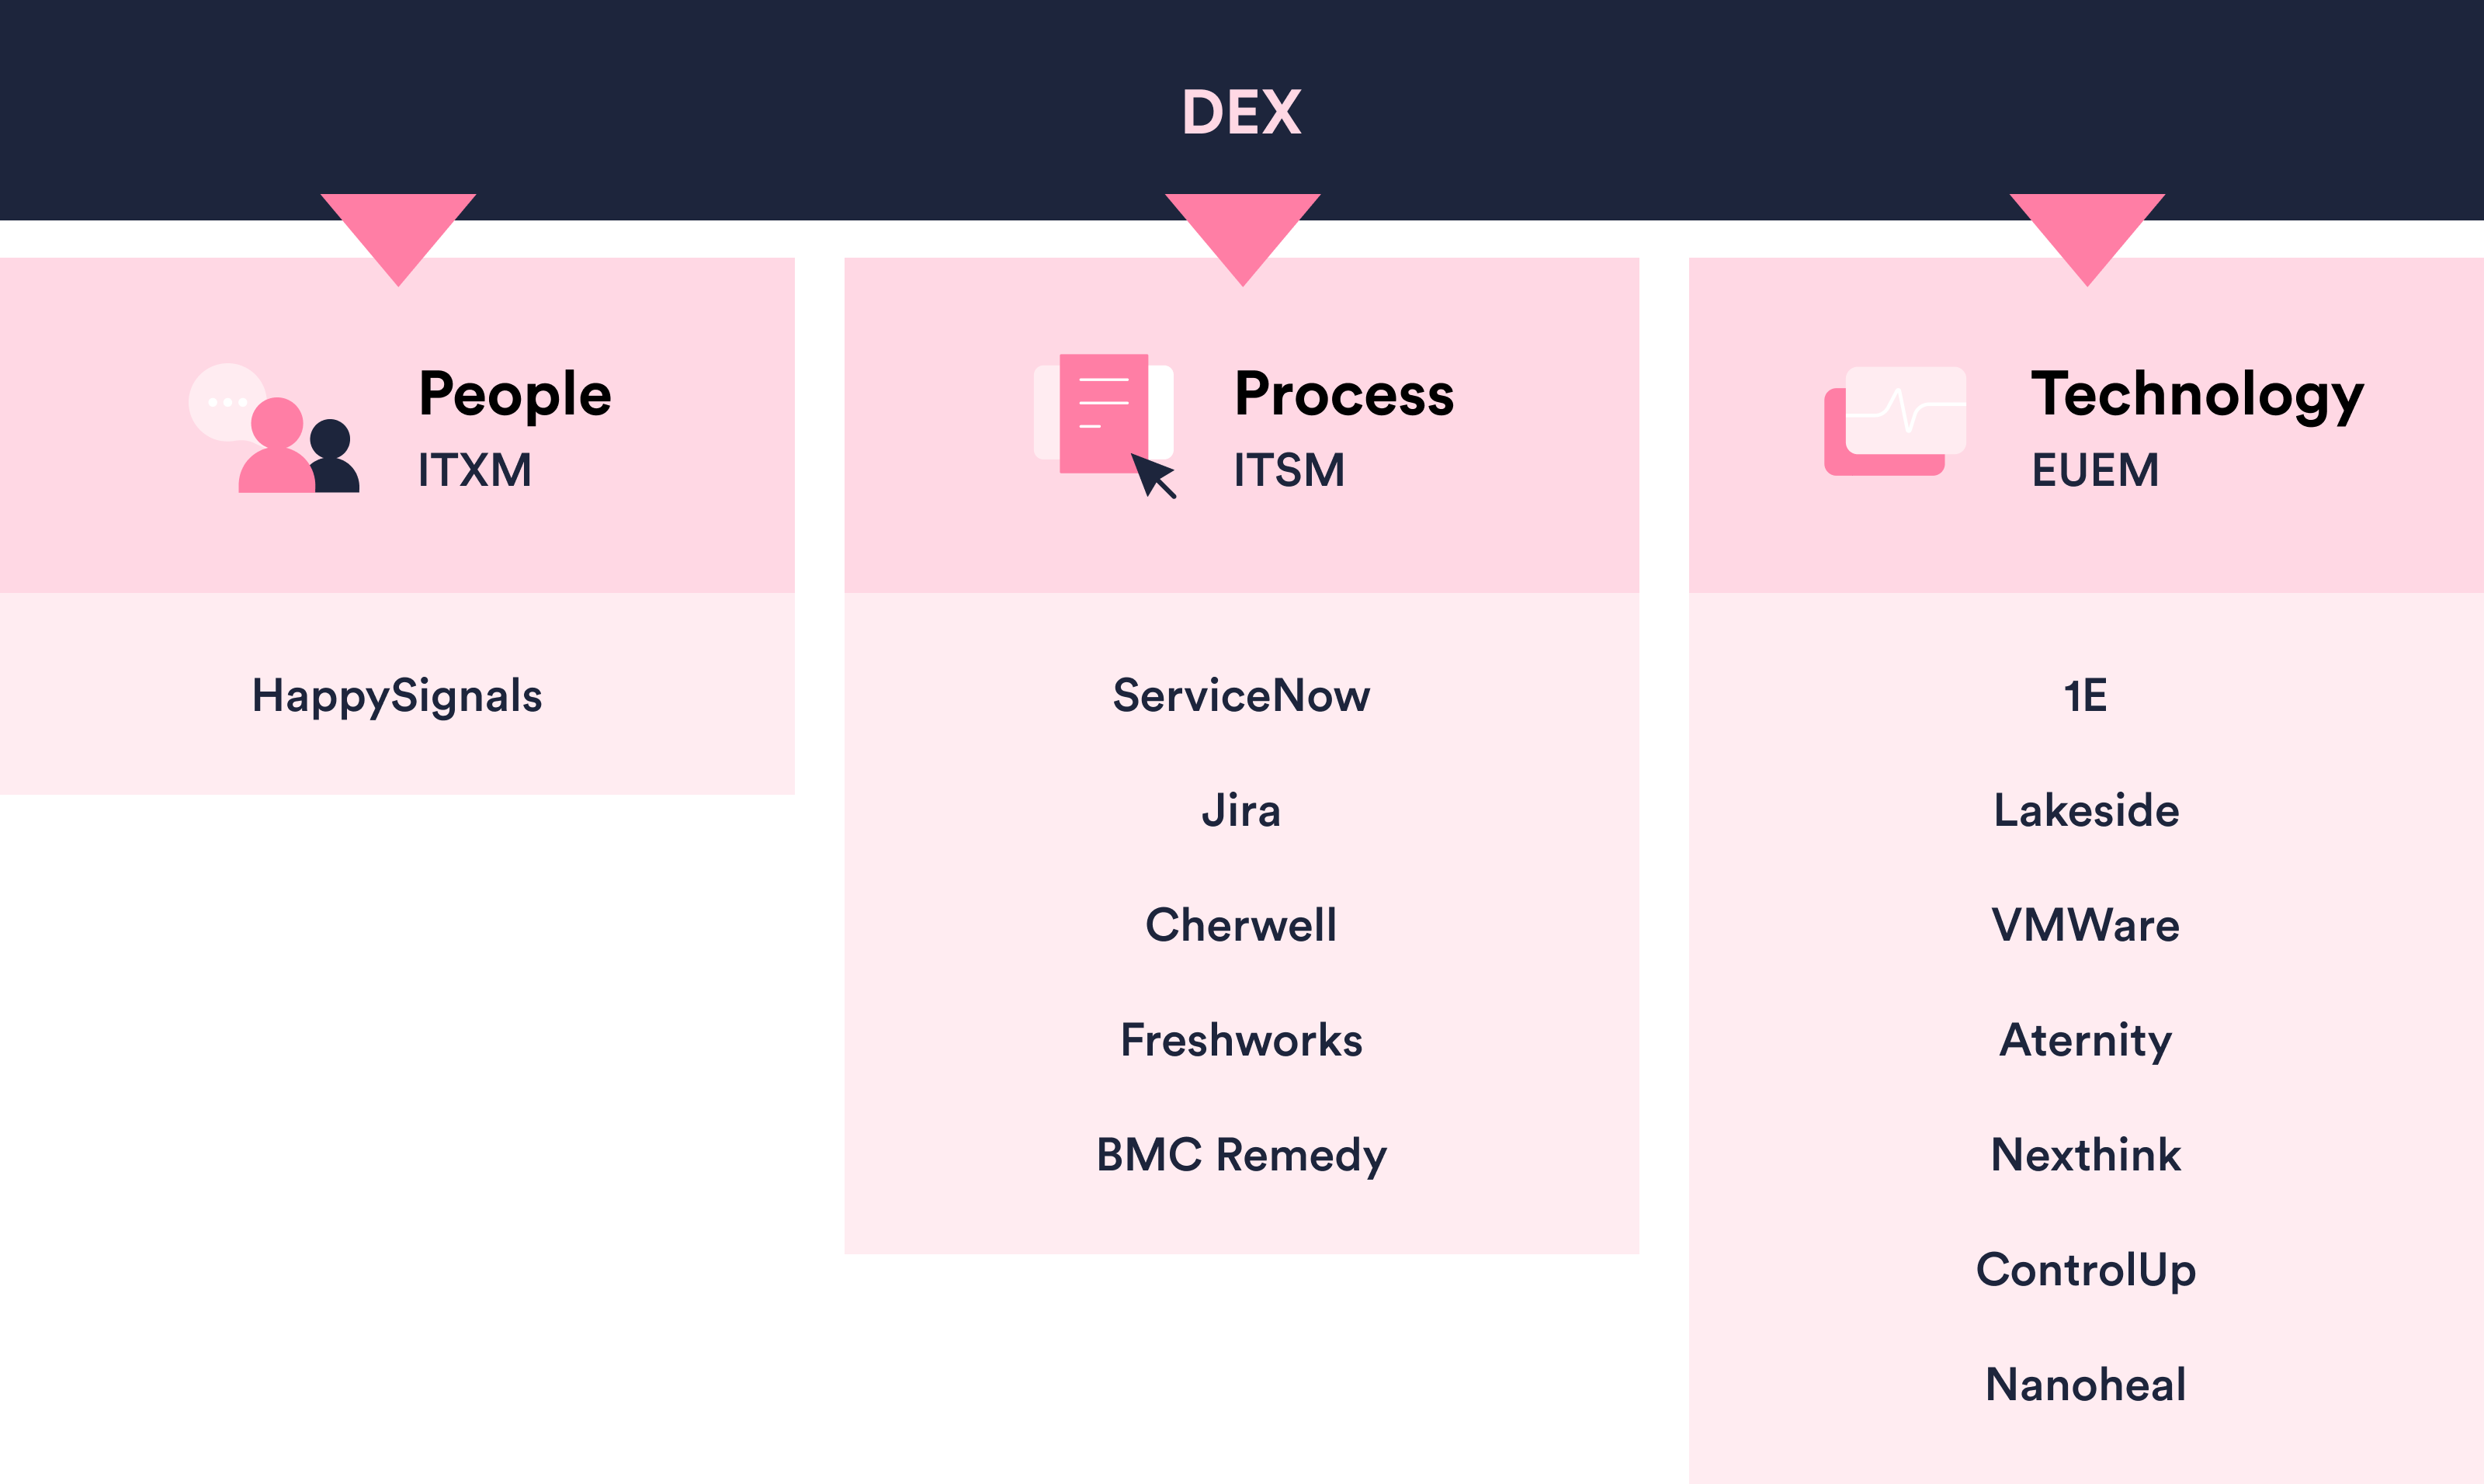
This year, the analyst community is converging towards looking at Digital Employee Experience (DEX) and Experience Level Agreements (XLAs) as higher-level categories, which include multiple sub-categories (or interpretations) related to IT Experience, also referred to as the digital experience in the workplace.
This evolution is encouraging. It means enterprises looking to build out Experience Management programs can more clearly see how different vendors can cover different aspects of DEX.
Consensus around the hierarchy and roles of different vendors, concepts and frameworks will help enterprises see beyond marketing terminology and identify what they really need to drive sustainable changes, which lead to more smiles and less time wasted - for both business end-users and IT workers alike.
HappySignals believes that the old adage of "People, Process, Technology... in that order" is important. Issues that matter with processes or technology will show up in perceived happiness and productivity losses - if they really matter to employees.
Uncertainty in markets can be a great reason to adopt experience-centric practices. The reason being that IT is never isolated from the wider realities in the world economy. Inflation, market insecurity and labor force movement lead to uncertainty. Enterprises are hence looking for ways to ensure stability and continuity. Having real-time IT Experience data that reflects how people feel about IT helps to focus limited resources where it matters. Less waste, more targeted actions.
Enterprise level IT operations are complex, and by no means easy to manage. There are very few IT professionals that would say they have all the resources and competencies that they want.
We believe one of the biggest reasons for failed projects are the assumptions they are built on. Without comparable, reliable and repeatable insights about end-user expectations, it is hard to know which projects will be perceived as valuable. Imagine what the cumulative ROI of IT investments would be, if almost every project was a success?
Only the projects perceived by end-users as being valuable for their work will get adopted and avoid joining the category of failed Digital Transformation projects. That's why IT Experience data is so crucial, and why the right success metrics matter a lot.
XLACollab found in 2019 that only 2% of people had heard of XLAs. In 2022, that awareness has gone up to 65%, with almost 10% knowing how to implement them. That is a big jump, but leaves over 90% still unsure of how to implement XLAs.
This contradiction is reflected in the gap between knowledge and sustainable practices in ITXM. Bridging that gap is likely the next frontier in IT Experience Management. We believe enterprise IT can truly benefit from simplifying experience management metrics and practices for wider organisational adoption. (Further reading: The Practical Guide to XLAs)
For HappySignals, our foundational premise is that Experience is inherently Human-Centric. Processes, devices, applications, and network speed are all still part of the picture. But ultimately, only the people who interact with the IT touchpoints can decide if their experience was bad, good, (or great!) This has been our approach since 2014 and our Benchmark report reflects this human-centric approach.
So if you are a CIO, IT Leader, Experience Owner, or Service Owner wanting to deliver great IT experiences to your end-users in 2022, consider if you really understand how people feel. Technology organically evolves to be bigger, faster and better, but how do the people using those technologies really feel about their experience?
Based on almost 840K end-user responses from January-June 2022 in enterprises that use HappySignals IT Experience Management Platform, this report presents insights about how end-users are experiencing IT, so as to enable you and your team’s work in today’s Experience-centric Enterprise IT landscape.
* Number is different from last report due to data quality improvements
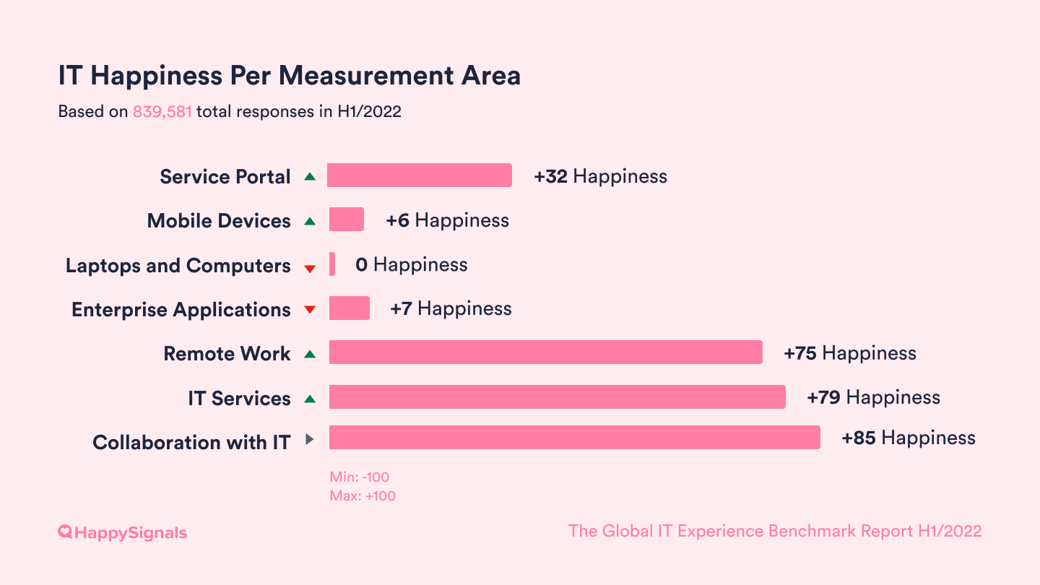
| Measurement Areas | H2/2021 Happiness | H1/2022 Happiness |
| Service Portal | +24 | +32 |
| Mobile Devices | -1 | +6 |
| Laptops and Computers | +14 | +0 |
| Enterprise Applications | +18 | +7 |
| Remote Work | +69 | +75 |
| IT Services | +77 | +79 |
| Collaboration with IT |
+85
|
+85 |
NB! When reading the overall Happiness for different IT measurement areas, remember that the scale is from -100 to +100, calculated with the same mathematical model as NPS. (Read about What is the difference between NPS and HappySignals?)
What is the business impact of ITXM on Overall IT Experience?You cannot know what you do not know. Almost every new customer gets surprised by which IT touchpoint actually makes their IT end-users happy. A typical misconception is that IT Services would be at the bottom, while they are commonly among the highest rated areas of IT. If your organisational goal is to improve the overall employee experience with digital technologies, knowing which areas are the most and least liked is important. Having real-time experience data across the different IT touchpoints will provide valuable insights that make conversations between IT, HR and business functions easier. Understanding overall IT Experience allows the enterprise to allocate resources based on employee feedback data, rather than leadership team members' gut feelings. That will lead to a higher rate of success in Digital Transformation projects. |
If you’re reading this report, one of your priorities is probably to deliver better Ticket-based IT services for end-users. But how do you do that, and where should you start? This chapter aims to shed light on what our data tells about these questions.
First, let’s recap how we measure end-user experience with Ticket-based IT (Incidents and Requests). HappySignals enables our customers to send surveys to end-users in connection with each ticket resolution, asking end-users to accept the resolution by giving feedback about their experience. The surveys ask questions around these metrics:
Happiness: End-users rate how happy they are with their recent service experience on a scale from 0-10. HappySignals then calculates: % of 9-10 scores - % of 0-6 scores = Overall Happiness (a number between -100 to 100).
Productivity: End-users estimate how much work time they lost due to the service experience.
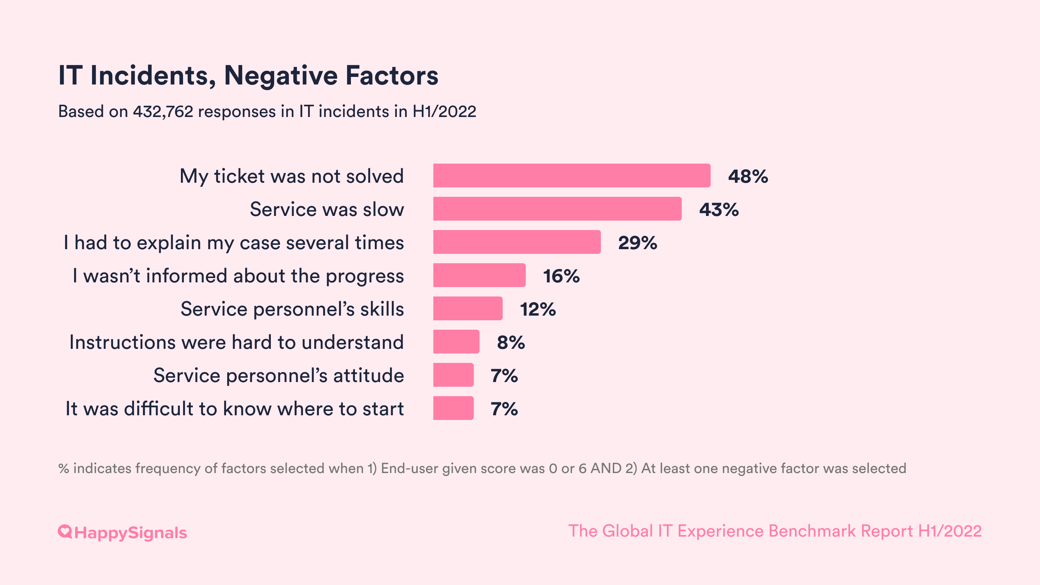
Factors: End-users select from a list of suggested reasons – which we call Factors – that influenced their Happiness rating: e.g. “Service was slow”, “My ticket was not solved”. Multiple factors can be selected.
To illustrate, one ticket-based experience might receive a Happiness rating of 5, Productivity loss of 2h 35min, due to the Factors “My ticket was not solved” and “Service was slow”.
This chapter analyzes data from 694,370 ticket-based IT experiences by end-users, who are served by IT organizations that use the HappySignals Platform.

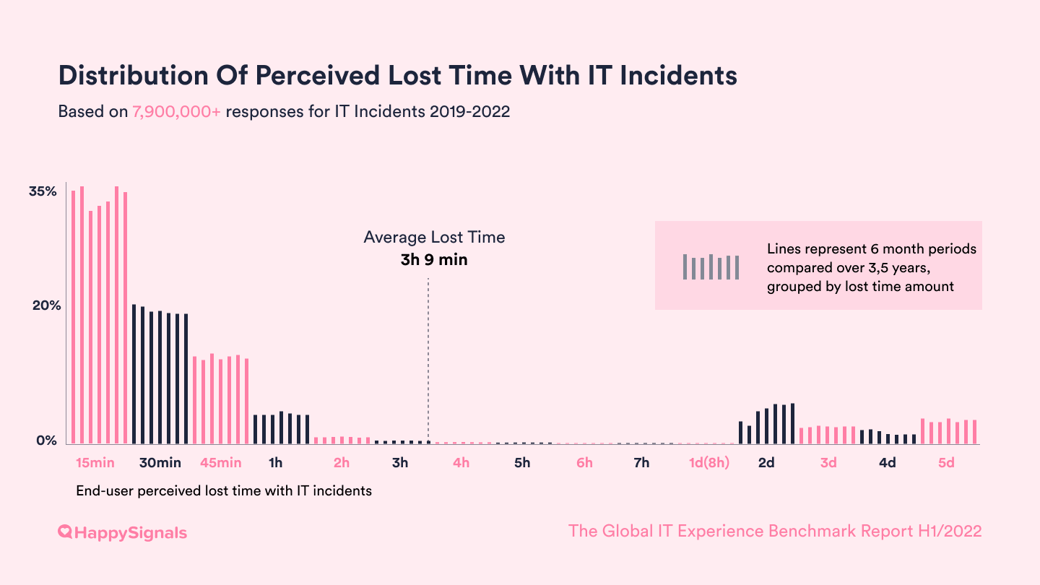
The upward trend over several years with IT incident resolutions happiness seems to have stabilized. In H2/2021, it reached a record high of +77, and it has remained on that same level. Average perceived lost time with IT incidents is very similar with a marginal increase of 3 minutes, sitting at a perceived lost productivity of 3h 9min with each IT incident.

When looking more closely at lost time across all incidents, we can see that the distribution of perceived lost time is unevenly represented at both sides of the spectrum. The historical trend shows how this polarization of the speed of service means that tickets that are solved in under 8 hours are solved even faster year after year, but tickets that lead to more than 8 hours of lost time take even longer.
This explains the paradox of slightly rising average lost times in the last couple of reports. Most end-users are receiving faster IT support with IT incidents, but the ones that do not, have to wait an increasingly long time. This leads to average lost time going up, due to the even longer waiting times for the tickets that lead to more than 8 hours of perceived lost time.
To improve ticket-based services, we have to understand the most common factors behind why end-users are unhappy with them. This ability to identify the reasons behind end-users’ reported happiness and lost time is one of the most valuable aspects of HappySignals IT Experience Management Platform.
In the survey sent to end-users in connection with a ticket resolution, we ask them to select from a standardized list of Factors, which were created based on our research with IT end-users. The Factors reflect the most common reasons for satisfaction or dissatisfaction with Ticket-based IT.
The timing of survey delivery also makes our Factors data more reliable, as it assesses end-users’ feelings about the service at the moment of their experience, rather than for example, months later in a yearly IT survey.
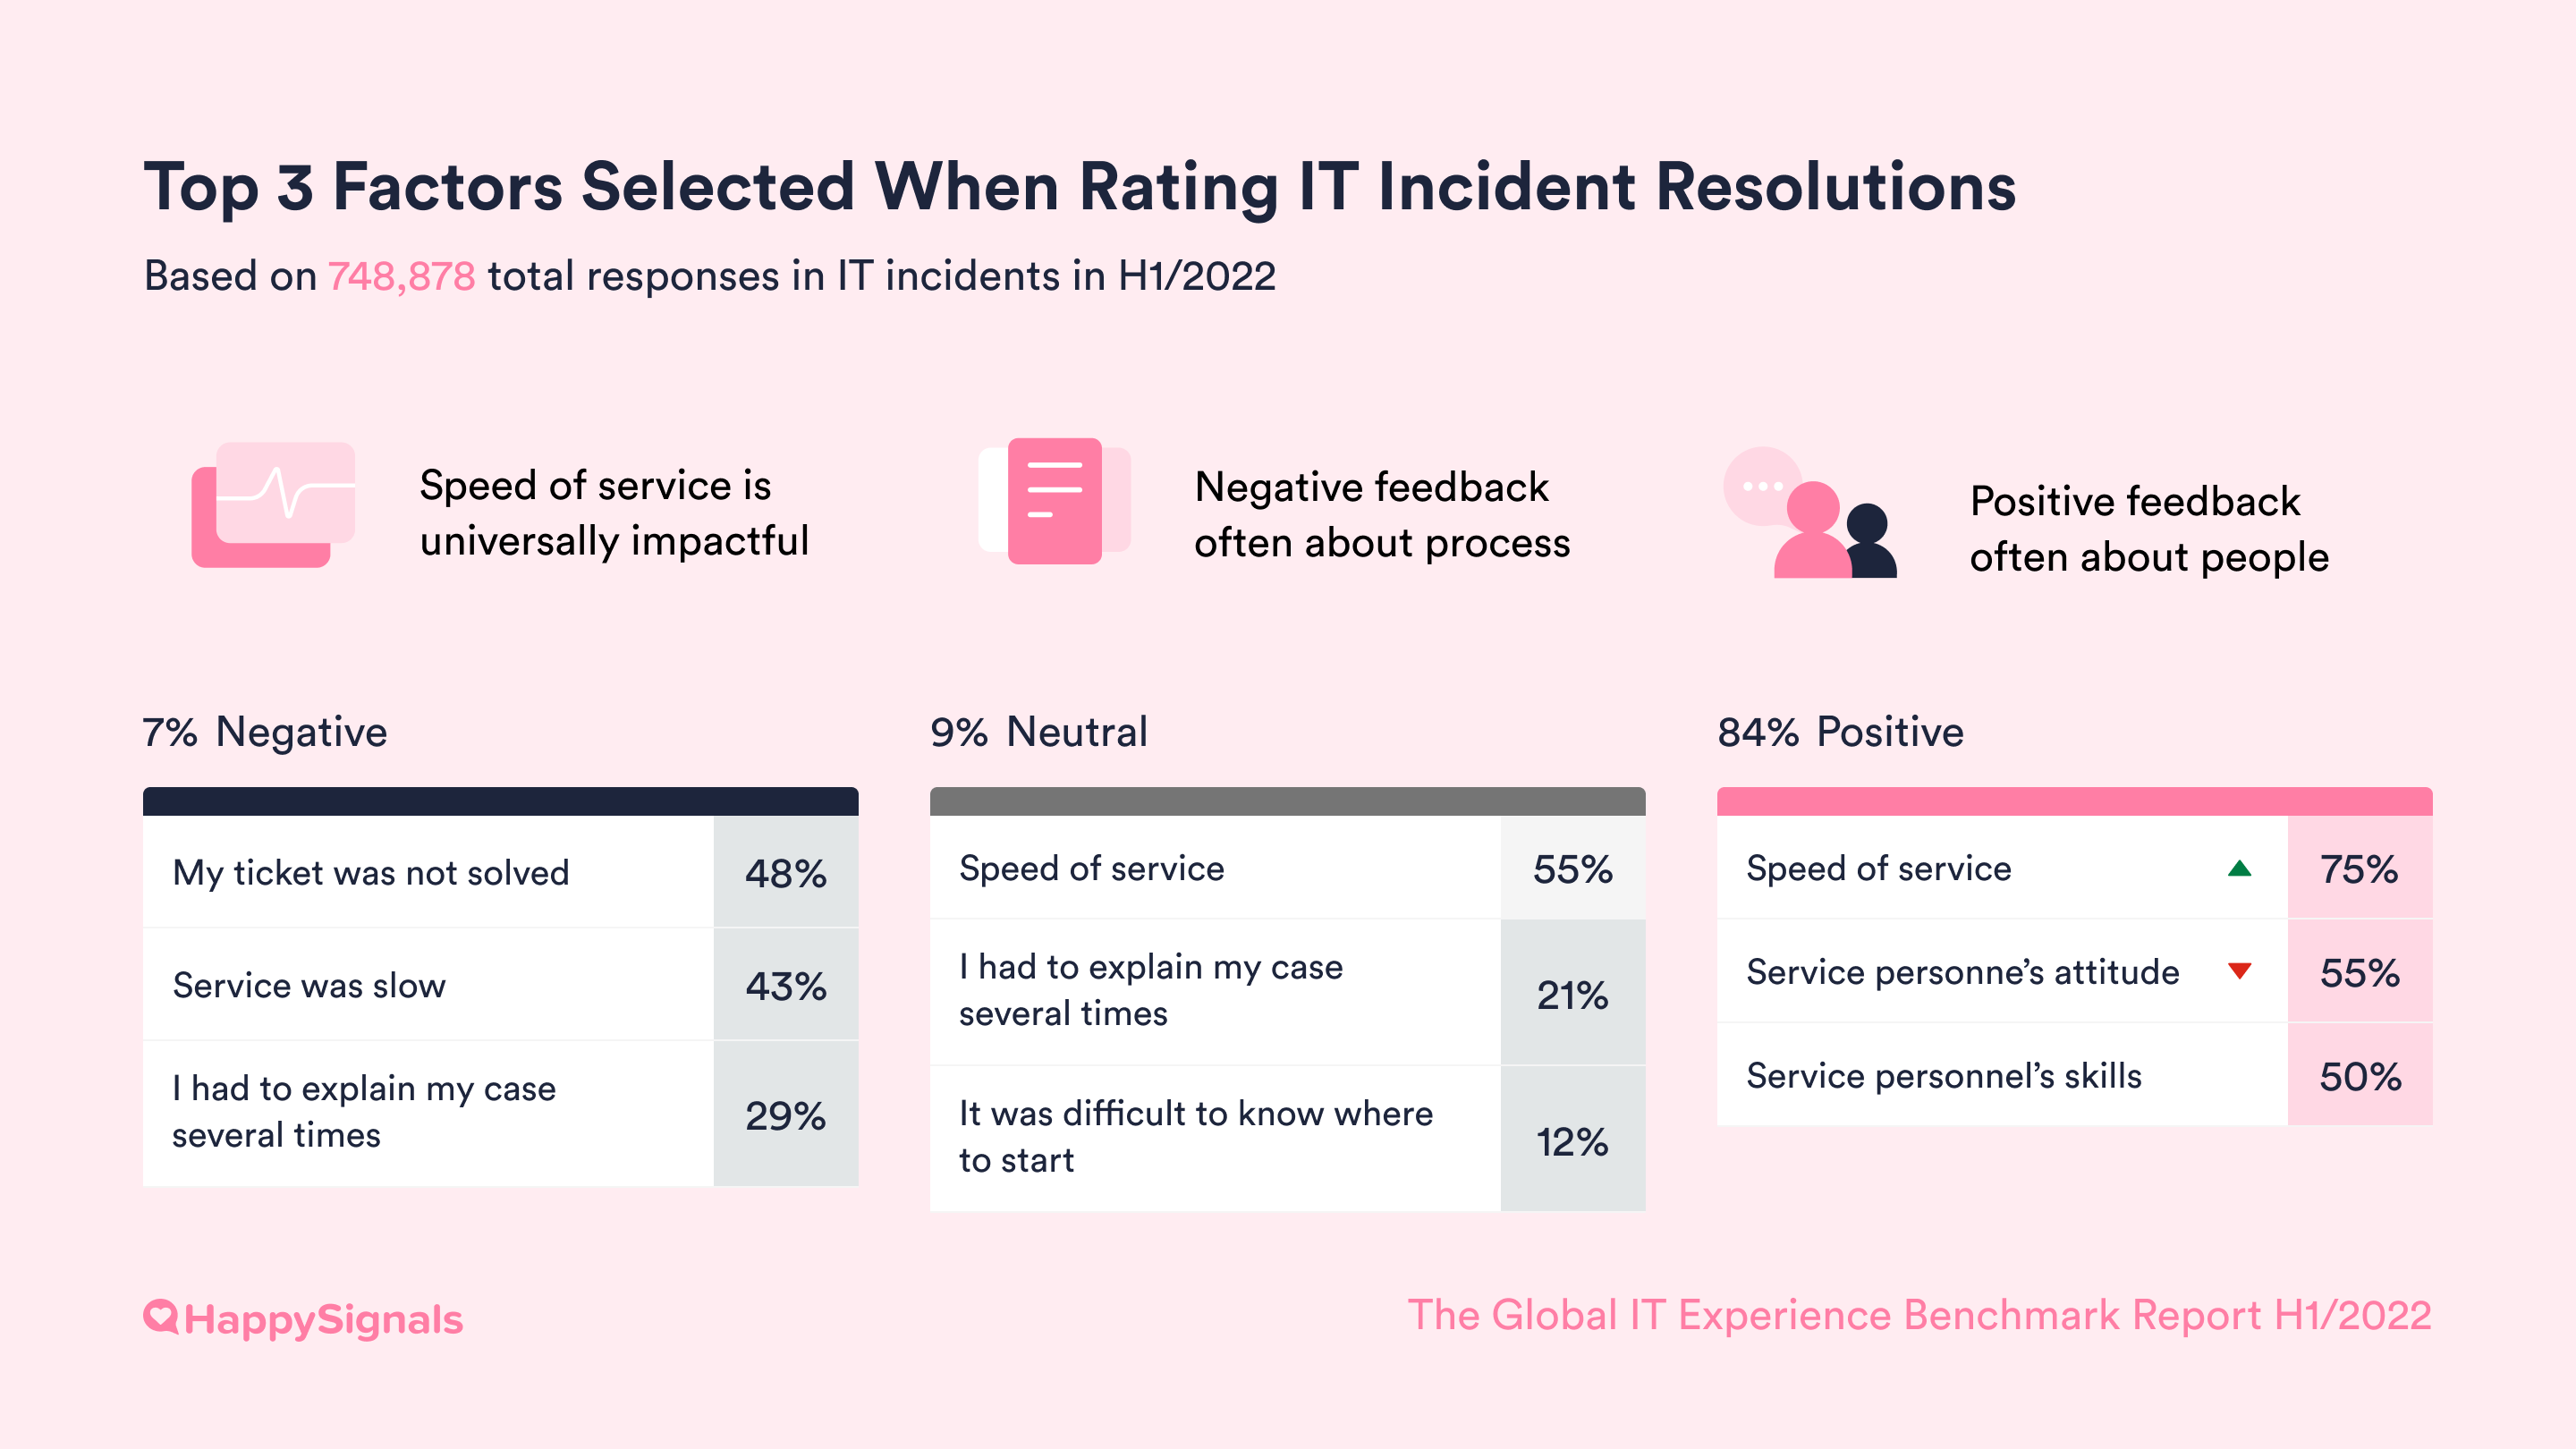
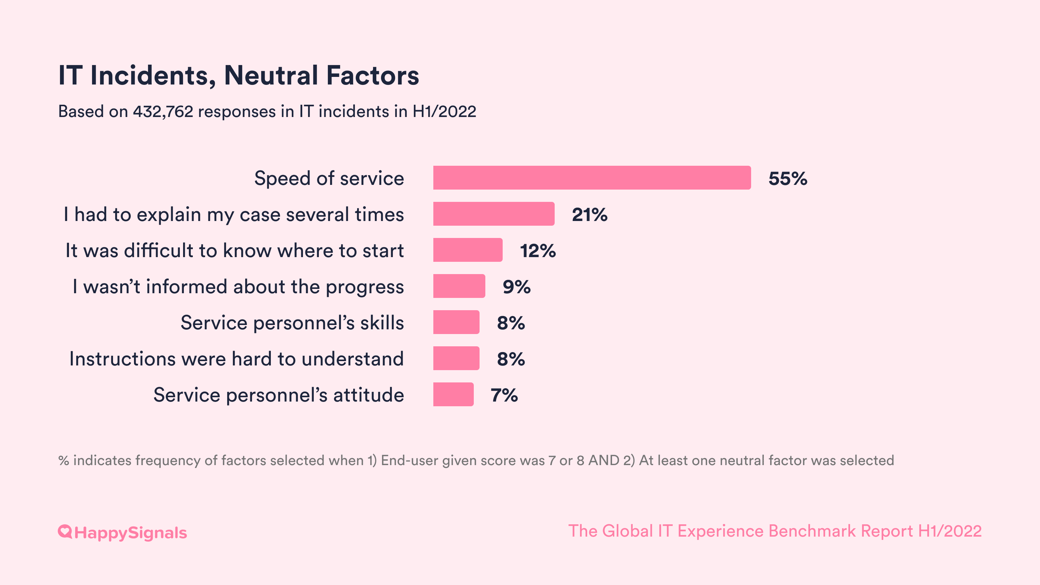
Different factors are presented to end-users to choose from, depending on the happiness rating they give on the 10-point scale. For example, scores from 0-6 are classified as a negative experience, so end-users are asked to select from a list of factors tailored for negative experiences. The same goes for scores from 7-8 (neutral experience), and 9-10 (positive experience). Certain service agent related factors are included in all three scenarios.
End-users can select as many factors as they wish from the list. This is also why the percentages shown in the factors data below add up to over 100%.
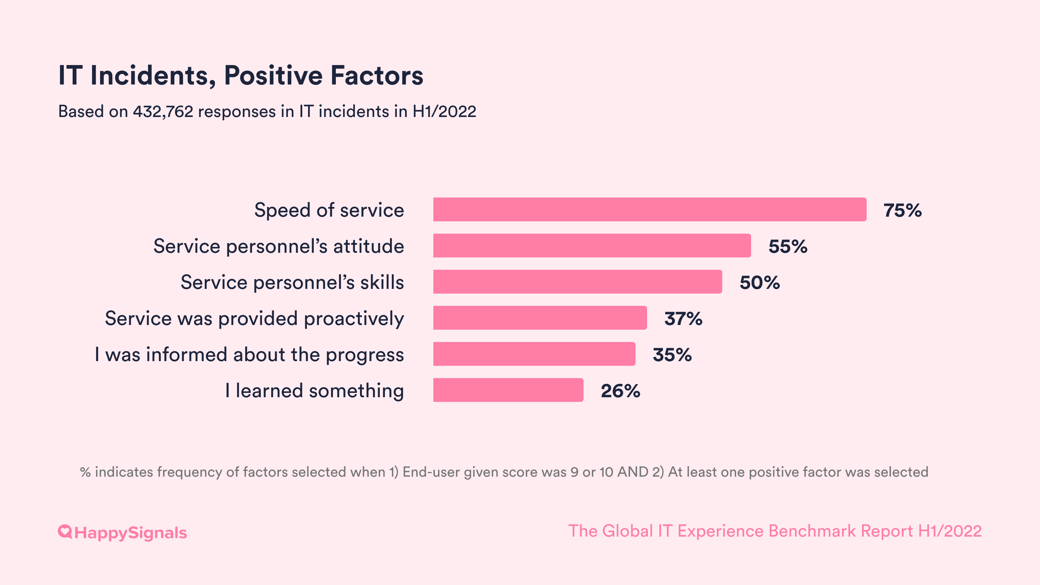
With IT incidents for example, 75% of responders who gave a positive happiness rating and selected at least one factor were happy about the speed of service.
The factors below are standardized across all of our customers, and anonymised for the Benchmark data.
End-users select the factors after having selected a level of happiness with the IT incident resolution. The score is selected on a scale of 0-10.
The factors are score specific to positive (9-10), neutral (7-8), and negative (0-6) scores.
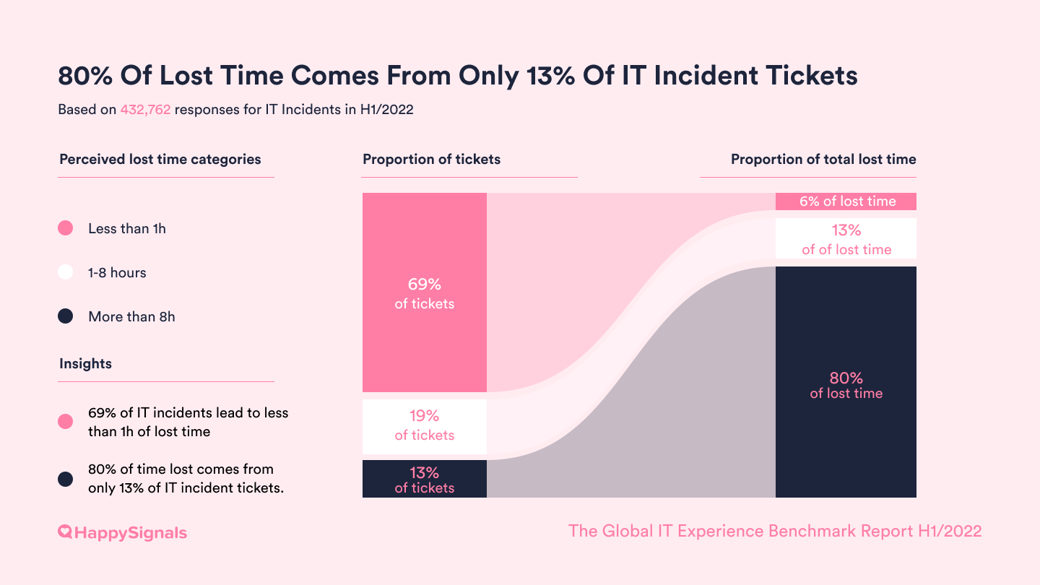
What is the business impact of ITXM on IT incident management?80% of time lost comes from only 12,5% of IT incident tickets. When lost time with incidents is more than 8 hours, the lost time is so much higher that despite it only accounting for a small share of tickets (12,5%), leads to 80% of the total reported lost time by end-users! This is like Pareto's law on steroids! Once the SLA is breached, it seems the agent doesn't care if it is by 5 minutes or 5 days. If you consider time to be money, then we recommend having automated mechanism that alerts managers when end-users report losing more than 8 hours of time, to avoid tickets being abandoned the moment the breach SLAs. With HappySignals ITXM™ Platform, you drill down in one click into Incidents where end-users lost >8h to investigate why. |
Discover detailed historical data in the PDF Report.
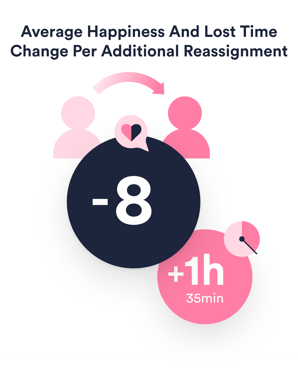
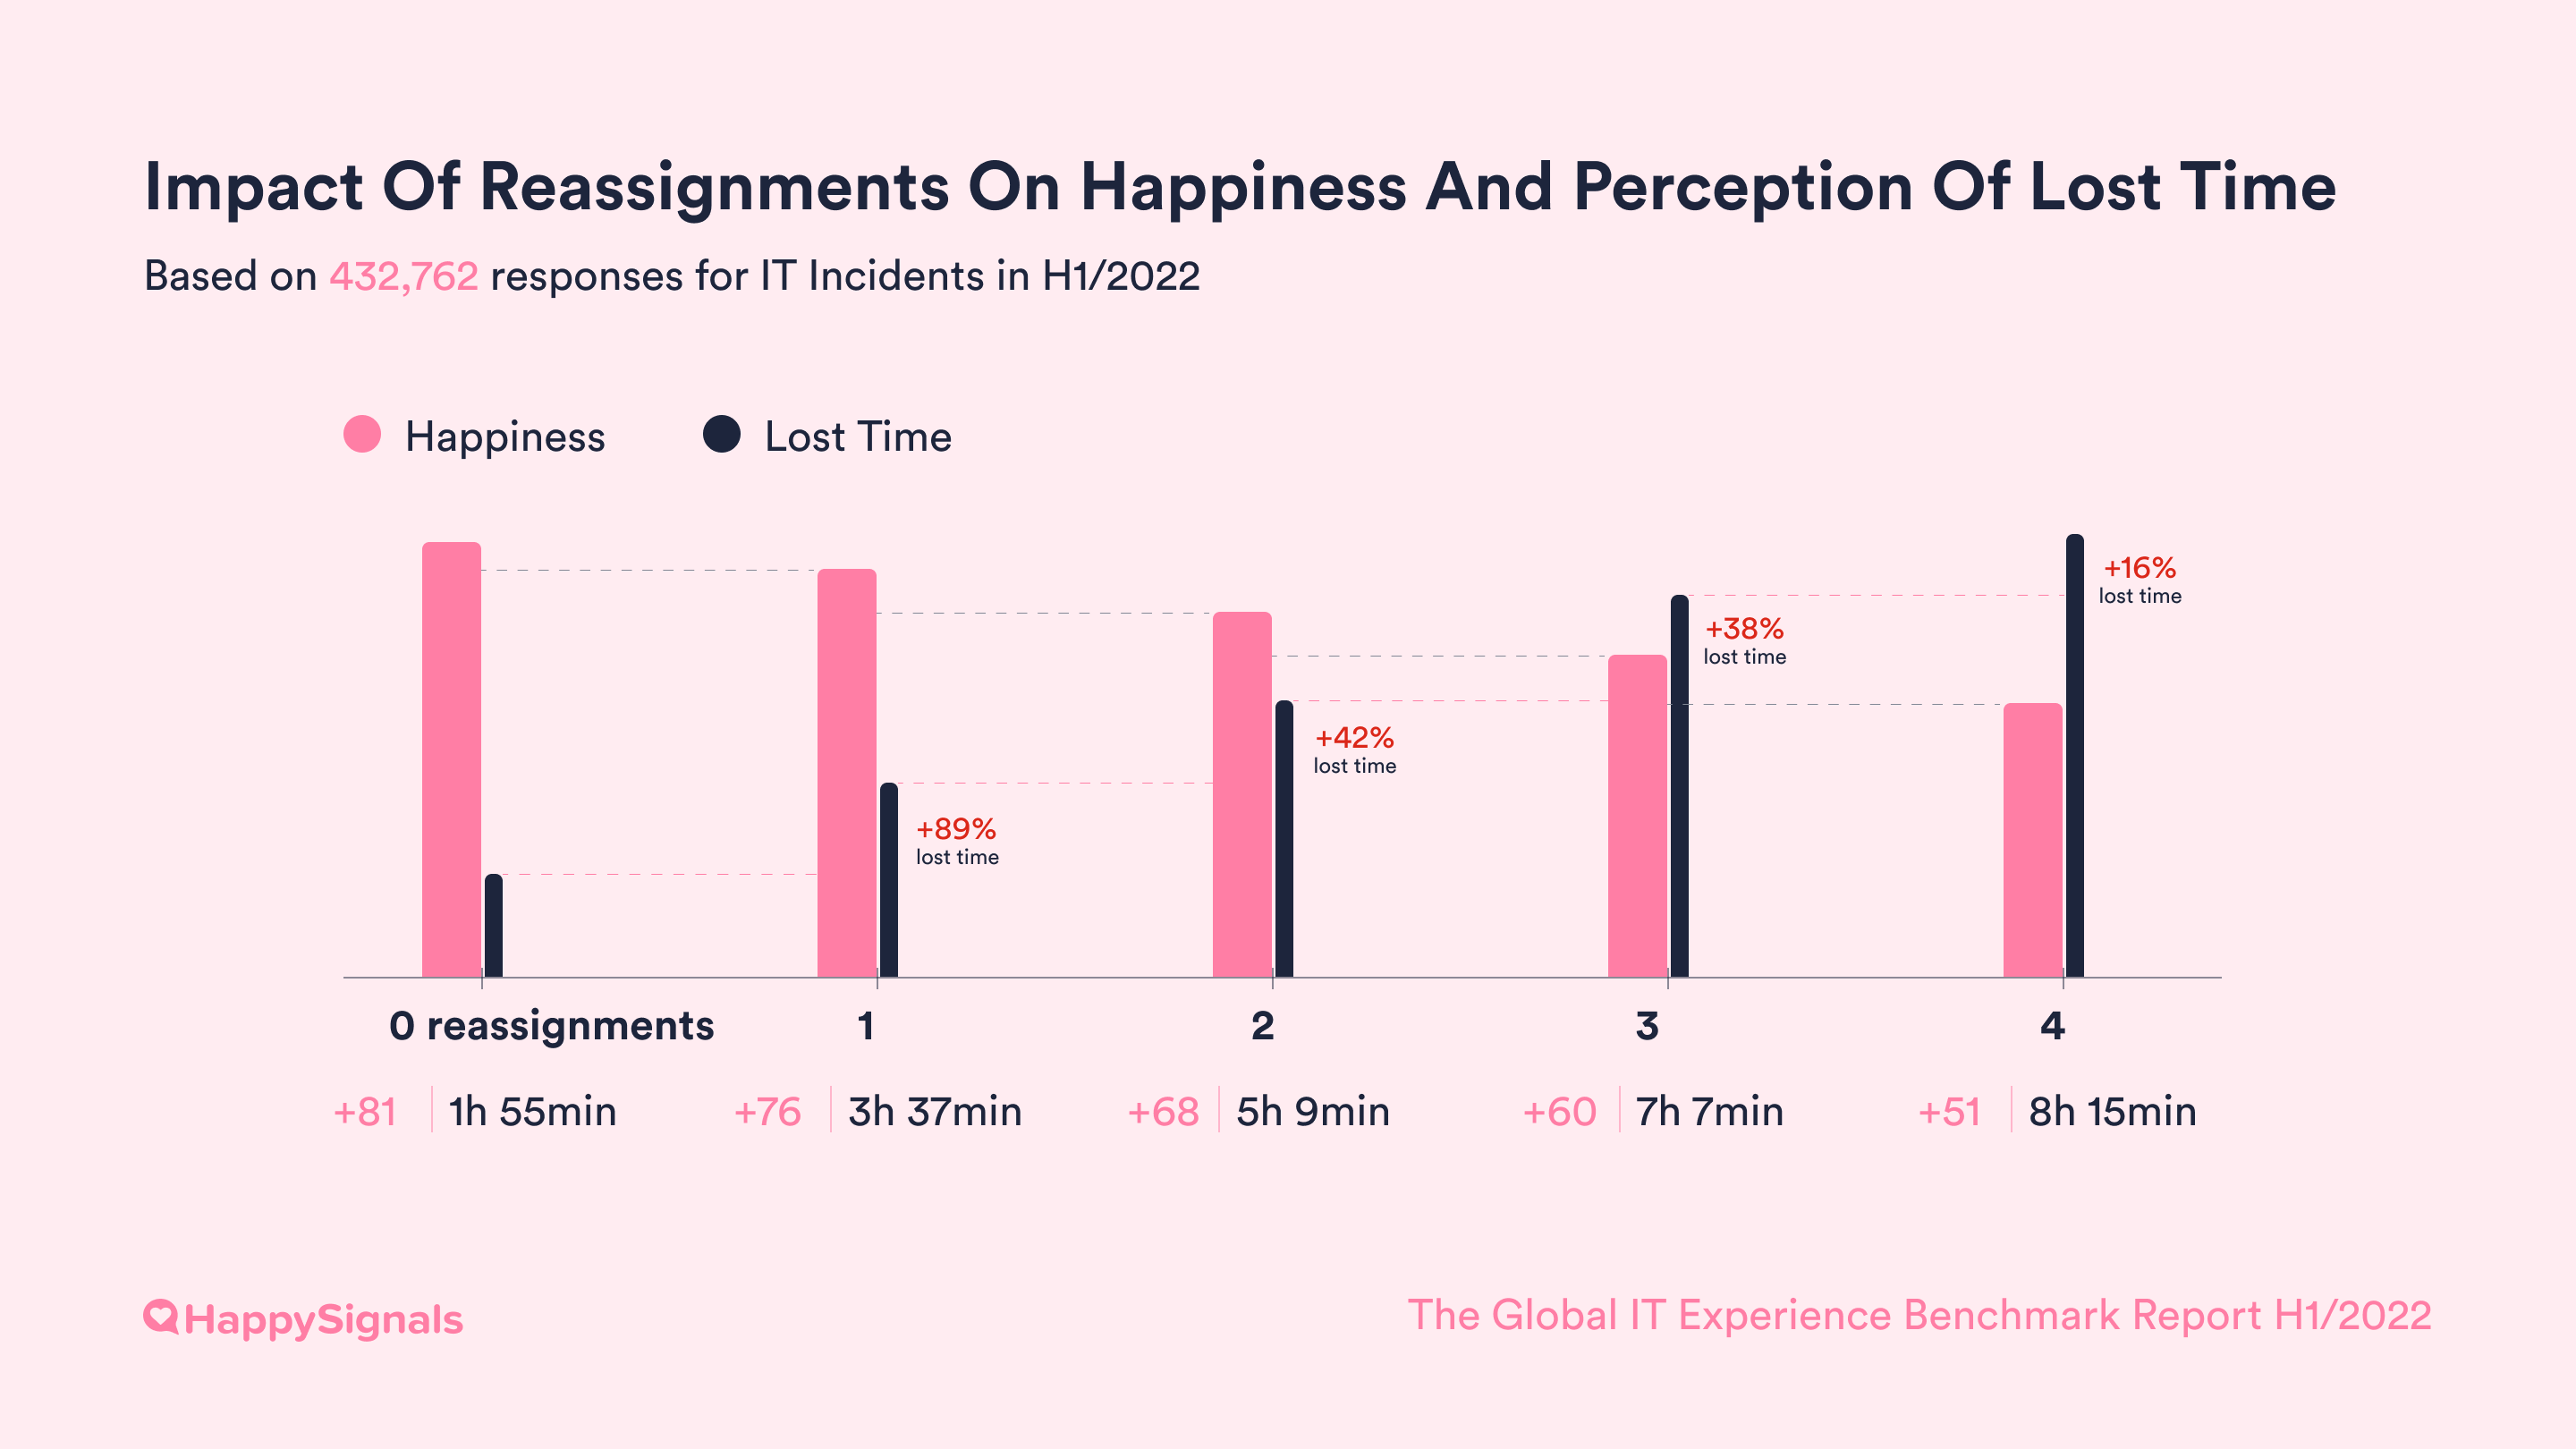
Each additional time a ticket is bounced, happiness falls by close to 8 points, while end-users lose 1h 35min more of their work time.
These add up to 8h 15min lost when tickets were reassigned four times!
Our data over the last 3 years about the frequency of ticket reassignments, and the Happiness and Lost Time end-users reported for different reassignment counts has remained quite stable with only small variations. Hence, we believe it is a reliable and predictable indicator of the impact of reassignments on end-user happiness and productivity.
What is the business impact of ITXM on ticket reassignments?Ticket reassignments have such a huge impact on end-user happiness and productivity, that it is one of the most important metrics for IT to understand and improve.
|
Developing channels is another important area of focus for IT teams in service delivery. To develop your channels in a way that makes employees happier, you need to start from reliable and granular experience data about how different channels are used and perceived by end-users.
Without getting (and using!) that data, IT teams may end up devoting resources to adding new channels for the sake of it and pushing end-users to use them, or improving channels that are already performing well rather than those that need attention.
Our data on channel usage mirrors recent trends in the ITSM industry of developing channels with automation and pre-determined user flows to reduce the number of tickets service desk agents have to handle.
This trend is likely to continue as IT organisations are looking at ways to become more efficient, while improving the overall customer experience. The investments in service portals, smart AI driven chats and proactive monitoring of services with self-healing capabilities all seek to optimise use of technology across different teams.
Our recommendation is to not lose sight of end-user needs by continuing to monitor how their experience changes, when support channel recommendations and usage is changing. If possible, aim to have an experience data baseline before the change, track changes during the change and establish conclusions by seeing what the experience is a few months after the change has been implemented.
NB! The total percentages do not add up to 100%, as we exclude channel categories that are not possible to reliably fit the existing 5 categories.
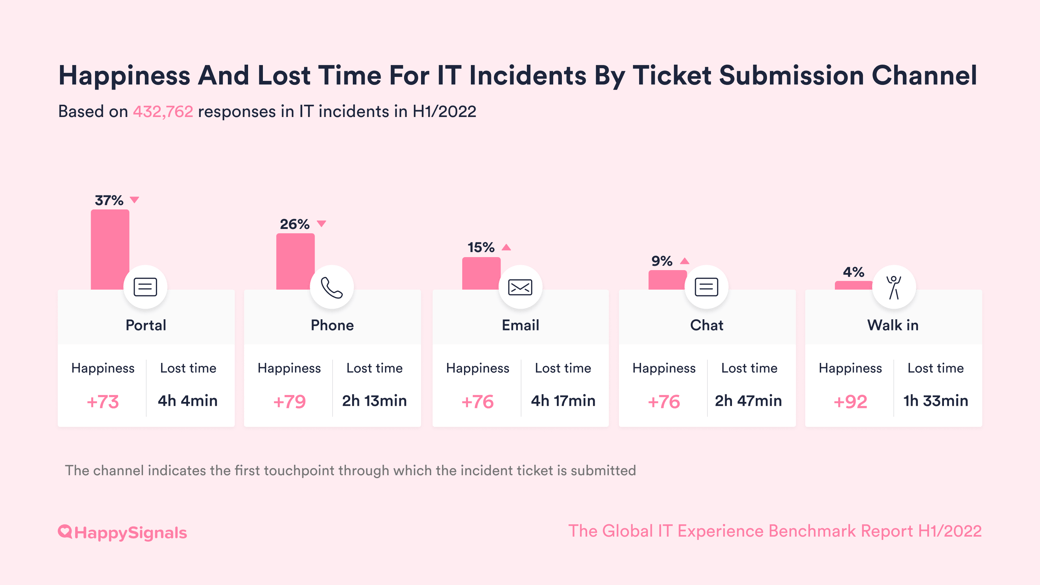
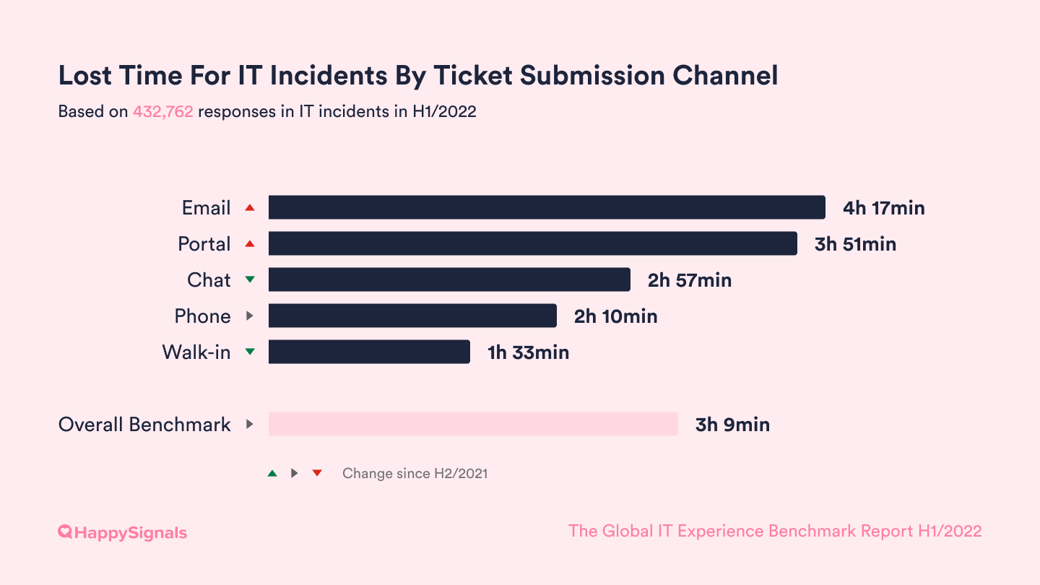
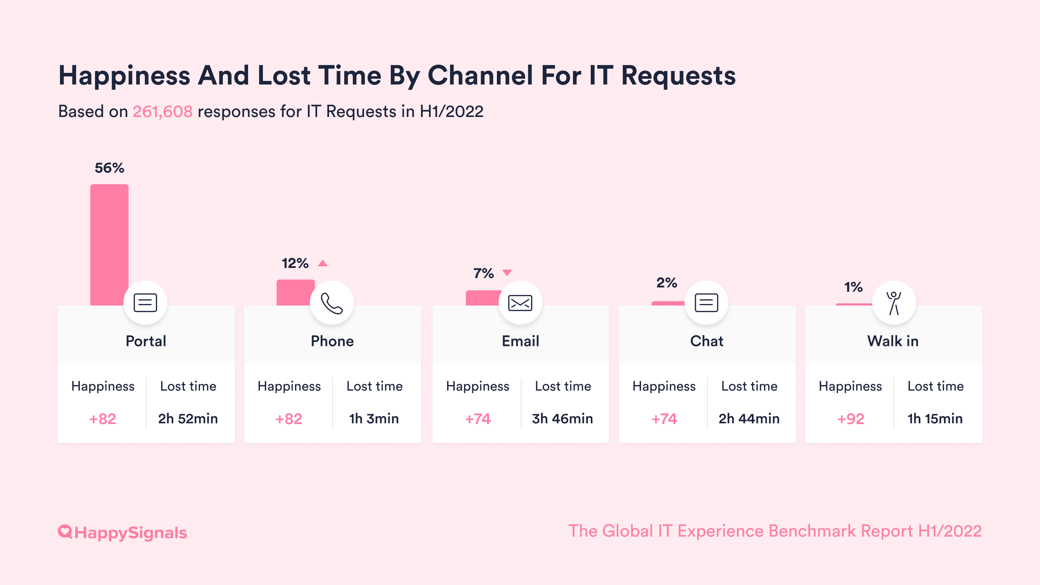
Based on the data from all our customers, there are only slight differences in overall happiness with the digital channels – Chat, Email, Phone, and Portal (all range from +73 to +79). The only channel with significantly higher happiness is Walk-in (+92). The perception of lost time is also by far the lowest for Walk-in IT support, with just 1h 41min on average per incident, 30 minutes less than the second least time-consuming channel, Phone.
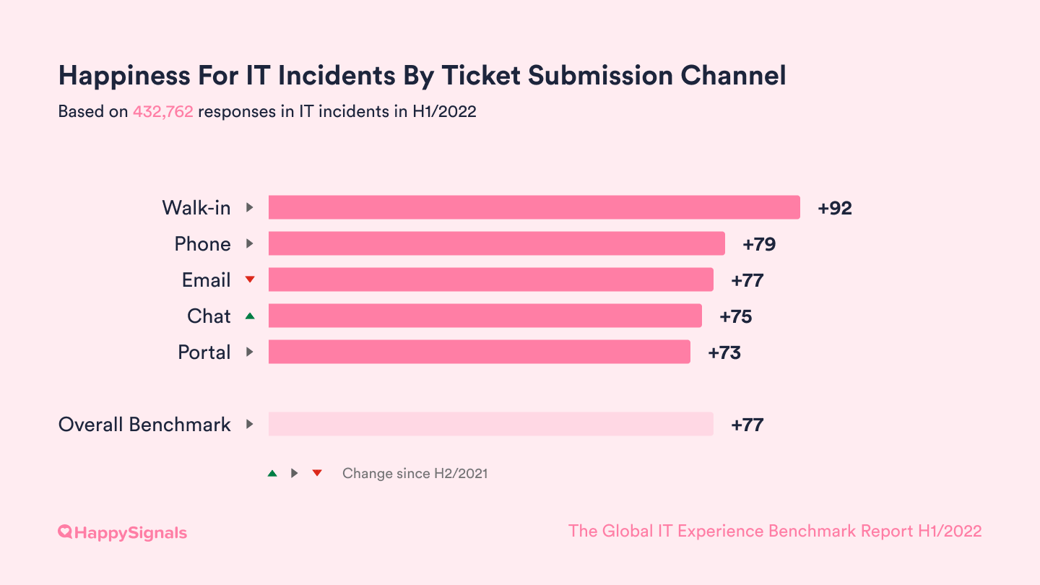
We hypothesize that end-users who use the Walk-in channel have much better experiences because talking to a service agent in-person likely results in the problem being resolved then and there. This reduces ticket reassignments and the likelihood of end-users needing to explain their case several times – both of which produce poorer experiences, as discussed in the previous section.
But while Walk-in delivers great service experiences, it is also the most expensive channel for IT to maintain. Many companies have stopped providing Walk-in because of how resource-intensive it is, and understandably so! For large multinational organizations without dedicated IT teams in every operating country, Walk-in will also be inaccessible to many employees. Hence, promoting Walk-in over digital channels isn’t a sustainable approach either.
What is the business impact of ITXM on IT Support Channel development?While the overall channel happiness data doesn’t reflect major differences between digital channels, we know from working with our customers that within each organization, there can be big differences!
|
While in previous sections we have discussed the experiences of IT end-users as a whole with various aspects of the IT service process, there are also behavioral and motivational differences between end-users. Understanding these differences is key to tailoring your IT services for different types of end-users.
This is where HappySignals IT Support Profiles come in handy.
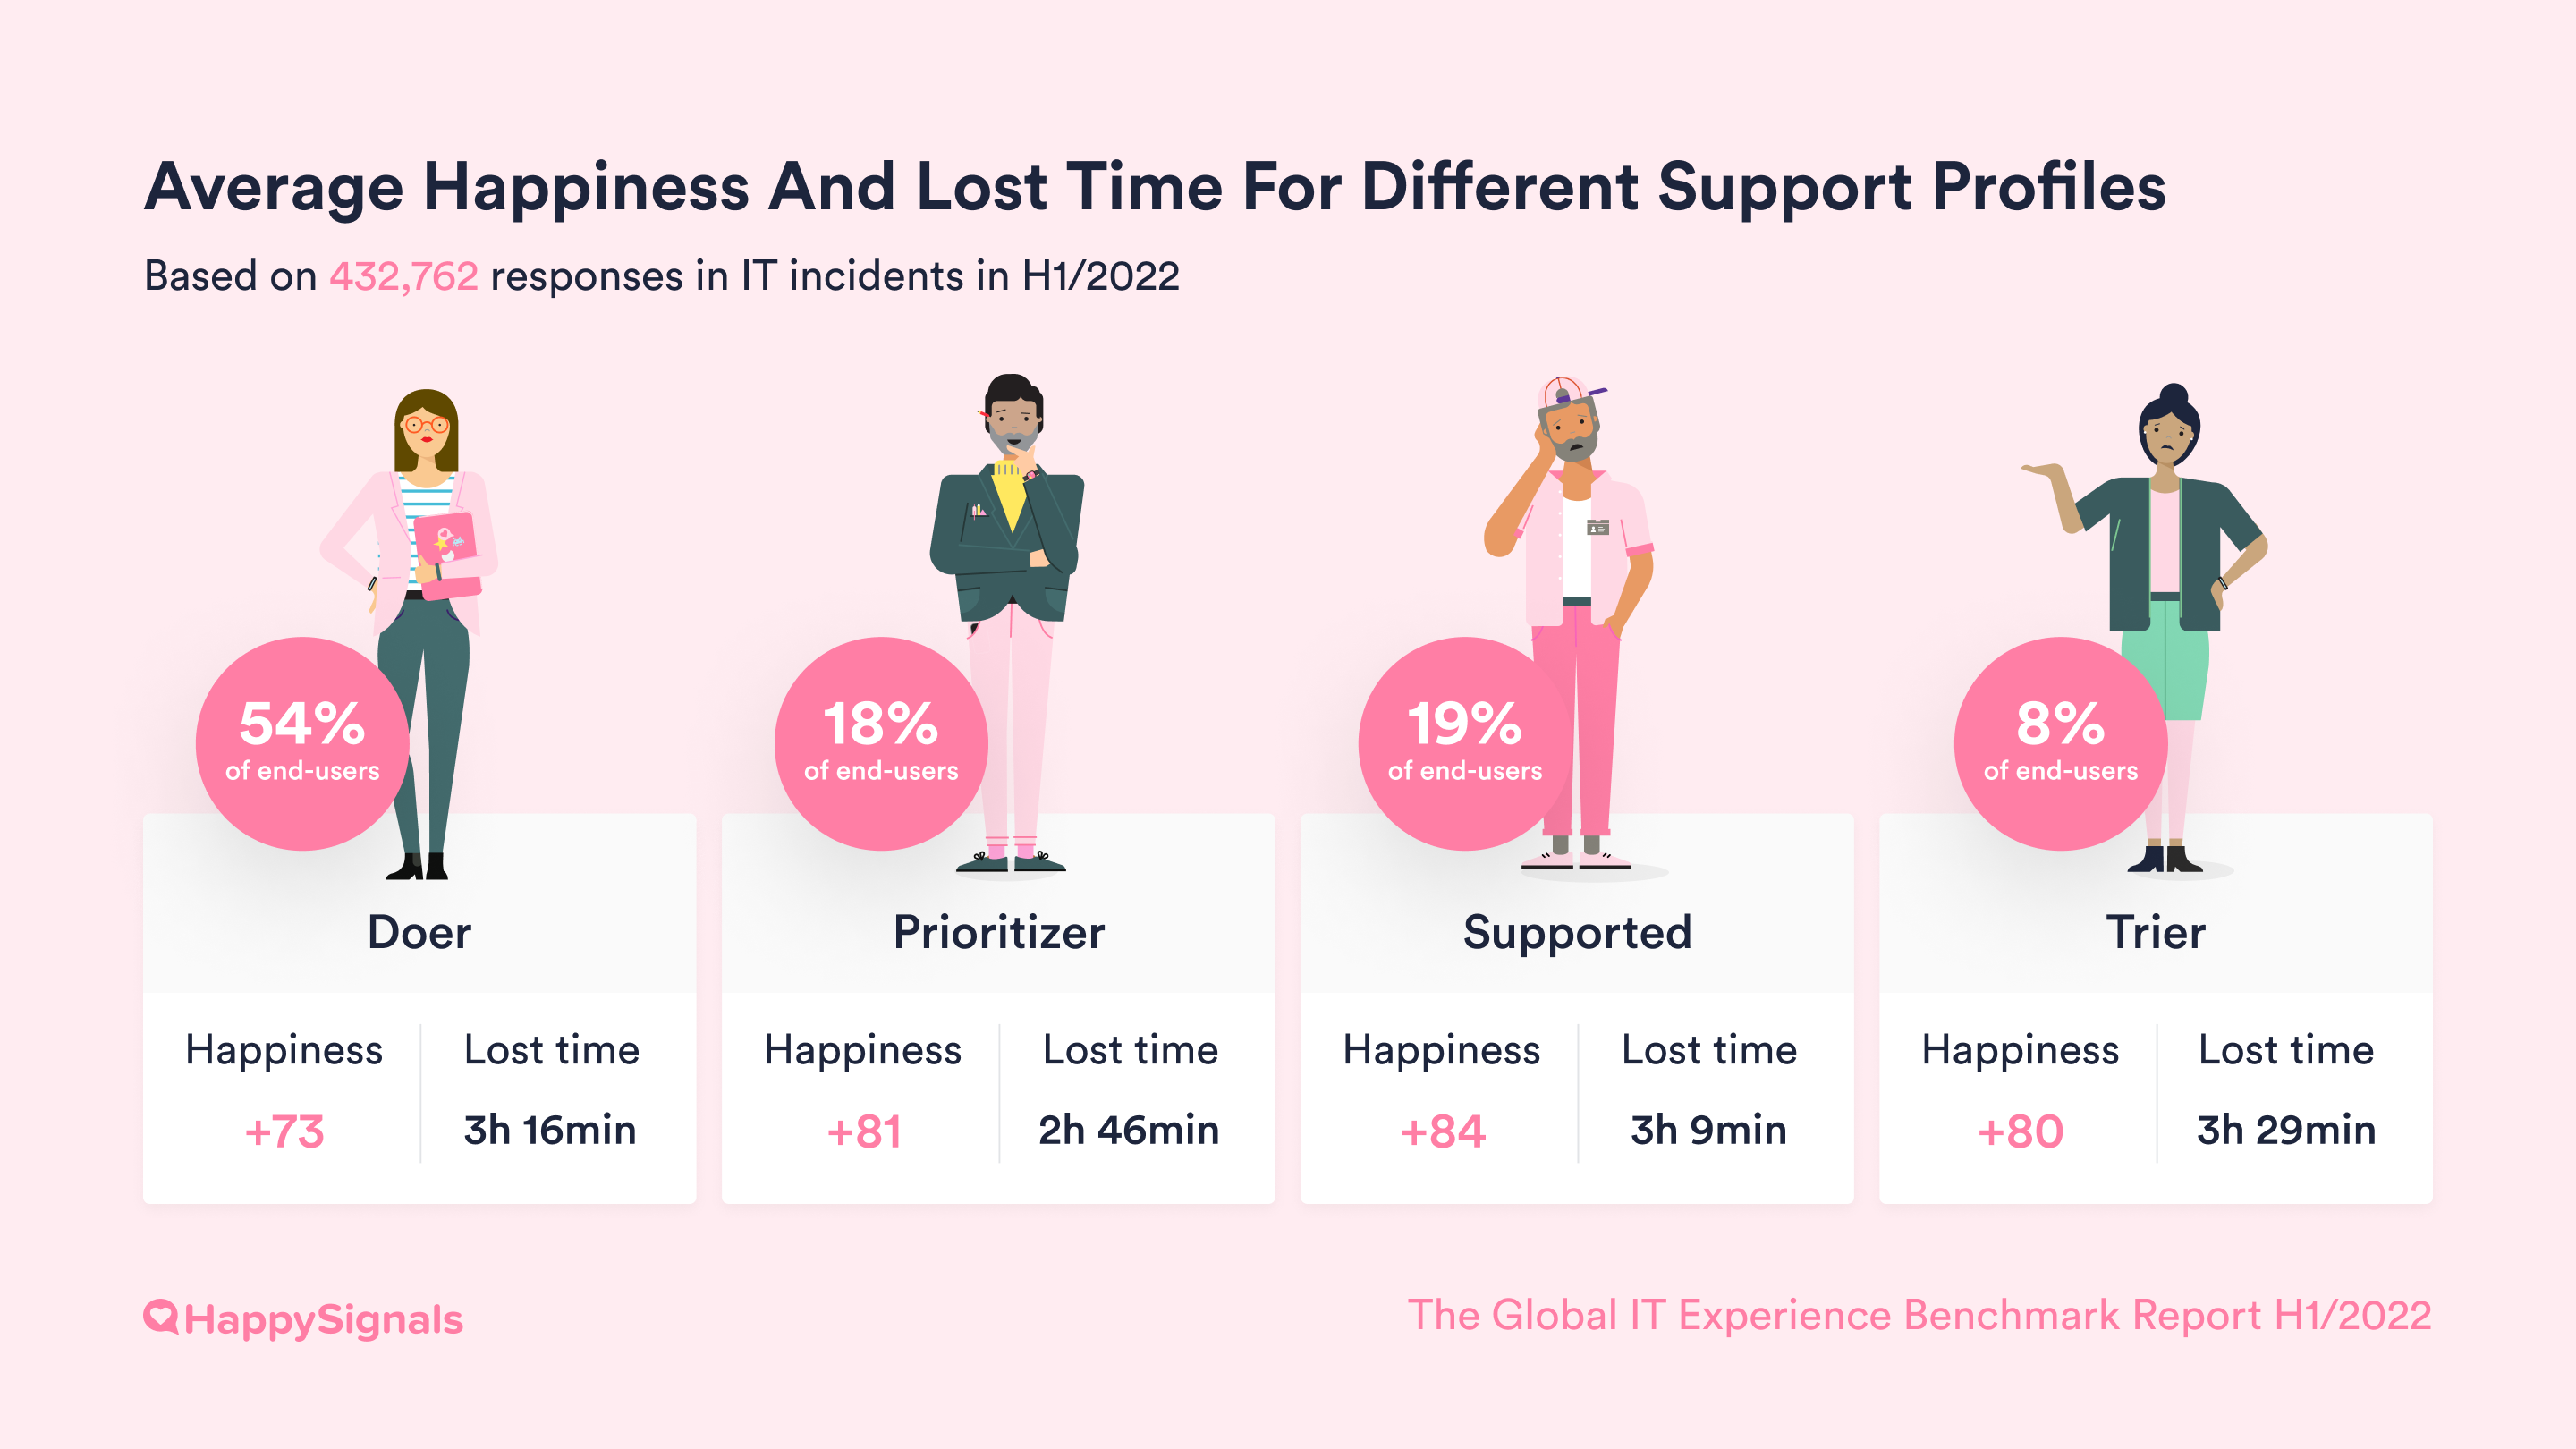
Based on interviews with over 500 end-users, we found two main behavioral drivers to have the greatest impact on end-user behavior and experience: Competence (how capable the end-user is of fixing IT problems independently), and Attitude (how willing the end-user is to solve the problem independently).
Mapping differences in these two drivers, we defined four Support Profiles: Doer, Prioritizer, Trier, and Supported. Learn more in our Guide on using Profiles in IT Service Desk.
Consistent with previous years, Doers again have the lowest Happiness of +73, while Supported are still the happiest with Happiness of +84.
Why have these patterns remained so stable? We have several hypotheses.
Since Doers are both capable and willing to solve most IT problems by themselves, they likely only raise tickets when faced with complex problems. Such problems are naturally also harder for service agents to solve quickly, making it harder to get good experience scores with Doers. As technically capable end-users, they may also be more demanding of service quality and speed.
As for the Supported, they are neither competent nor eager to solve IT problems on their own and just want someone to help them out. They may be less demanding of IT services, resulting in higher Happiness ratings on average. They may also raise tickets even for simple issues which are easy for agents to solve, producing smoother service experiences.
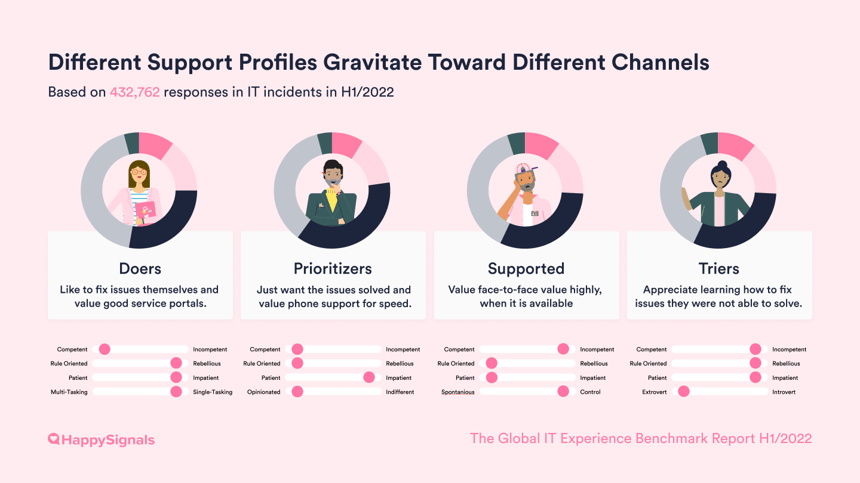
It is fascinating to notice how different support profiles gravitate towards different channels, in a way that confirms the behavioral drivers identified in our original research about IT Support Profiles! The data on IT incident channel usage by different profiles highlights the following patterns:
Doers, who like fixing issues themselves, are by far the most avid users of self-service Portals and the least likely to use Phone.
Prioritizers on the other hand, use Phone more frequently than other support profiles, which fits their profile of wanting problems solved with minimal participation – a 'someone should do it for me' attitude.
Supported and Triers use Walk-in IT support 30-35% more frequently than Doers and Prioritizers, which is in line with their preference for personal help that enables them to learn, from service personnel that are patient with them.
We recommend downloading our Definitive Guide on IT Support Profiles for more information about how you can tailor your services to better serve different end-users in the organisation.
What is the business impact of understanding end-user IT Support Profiles?You cannot change your end-users, but you can tailor your IT services to different support profiles. For example, by personalizing how service agents talk to different profiles the next time they reach out to the service desk. Doers and Prioritisers are more comfortable with technical language, while Supported and Triers may appreciate plain language and clear step-by-step walkthroughs.
|
| Channel usage for IT Requests | H2/2019 | H1/2020 | H2/2020 | H1/2021 | H2/2021 | H1/2022 |
| Chat | 1% | 2% | 2% | 3% | 3% | 2% |
| 8% | 8% | 7% | 10% | 8% | 7% | |
| Phone | 22% | 19% | 17% | 13% | 11% | 12% |
| Portal | 60% | 50% | 57% | 57% | 56% | 56% |
| Walk in | 1% | 2% | 2% | 2% | 1% | 1% |
| Other | 8% | 19% | 15% | 15% | 22% | 22% |
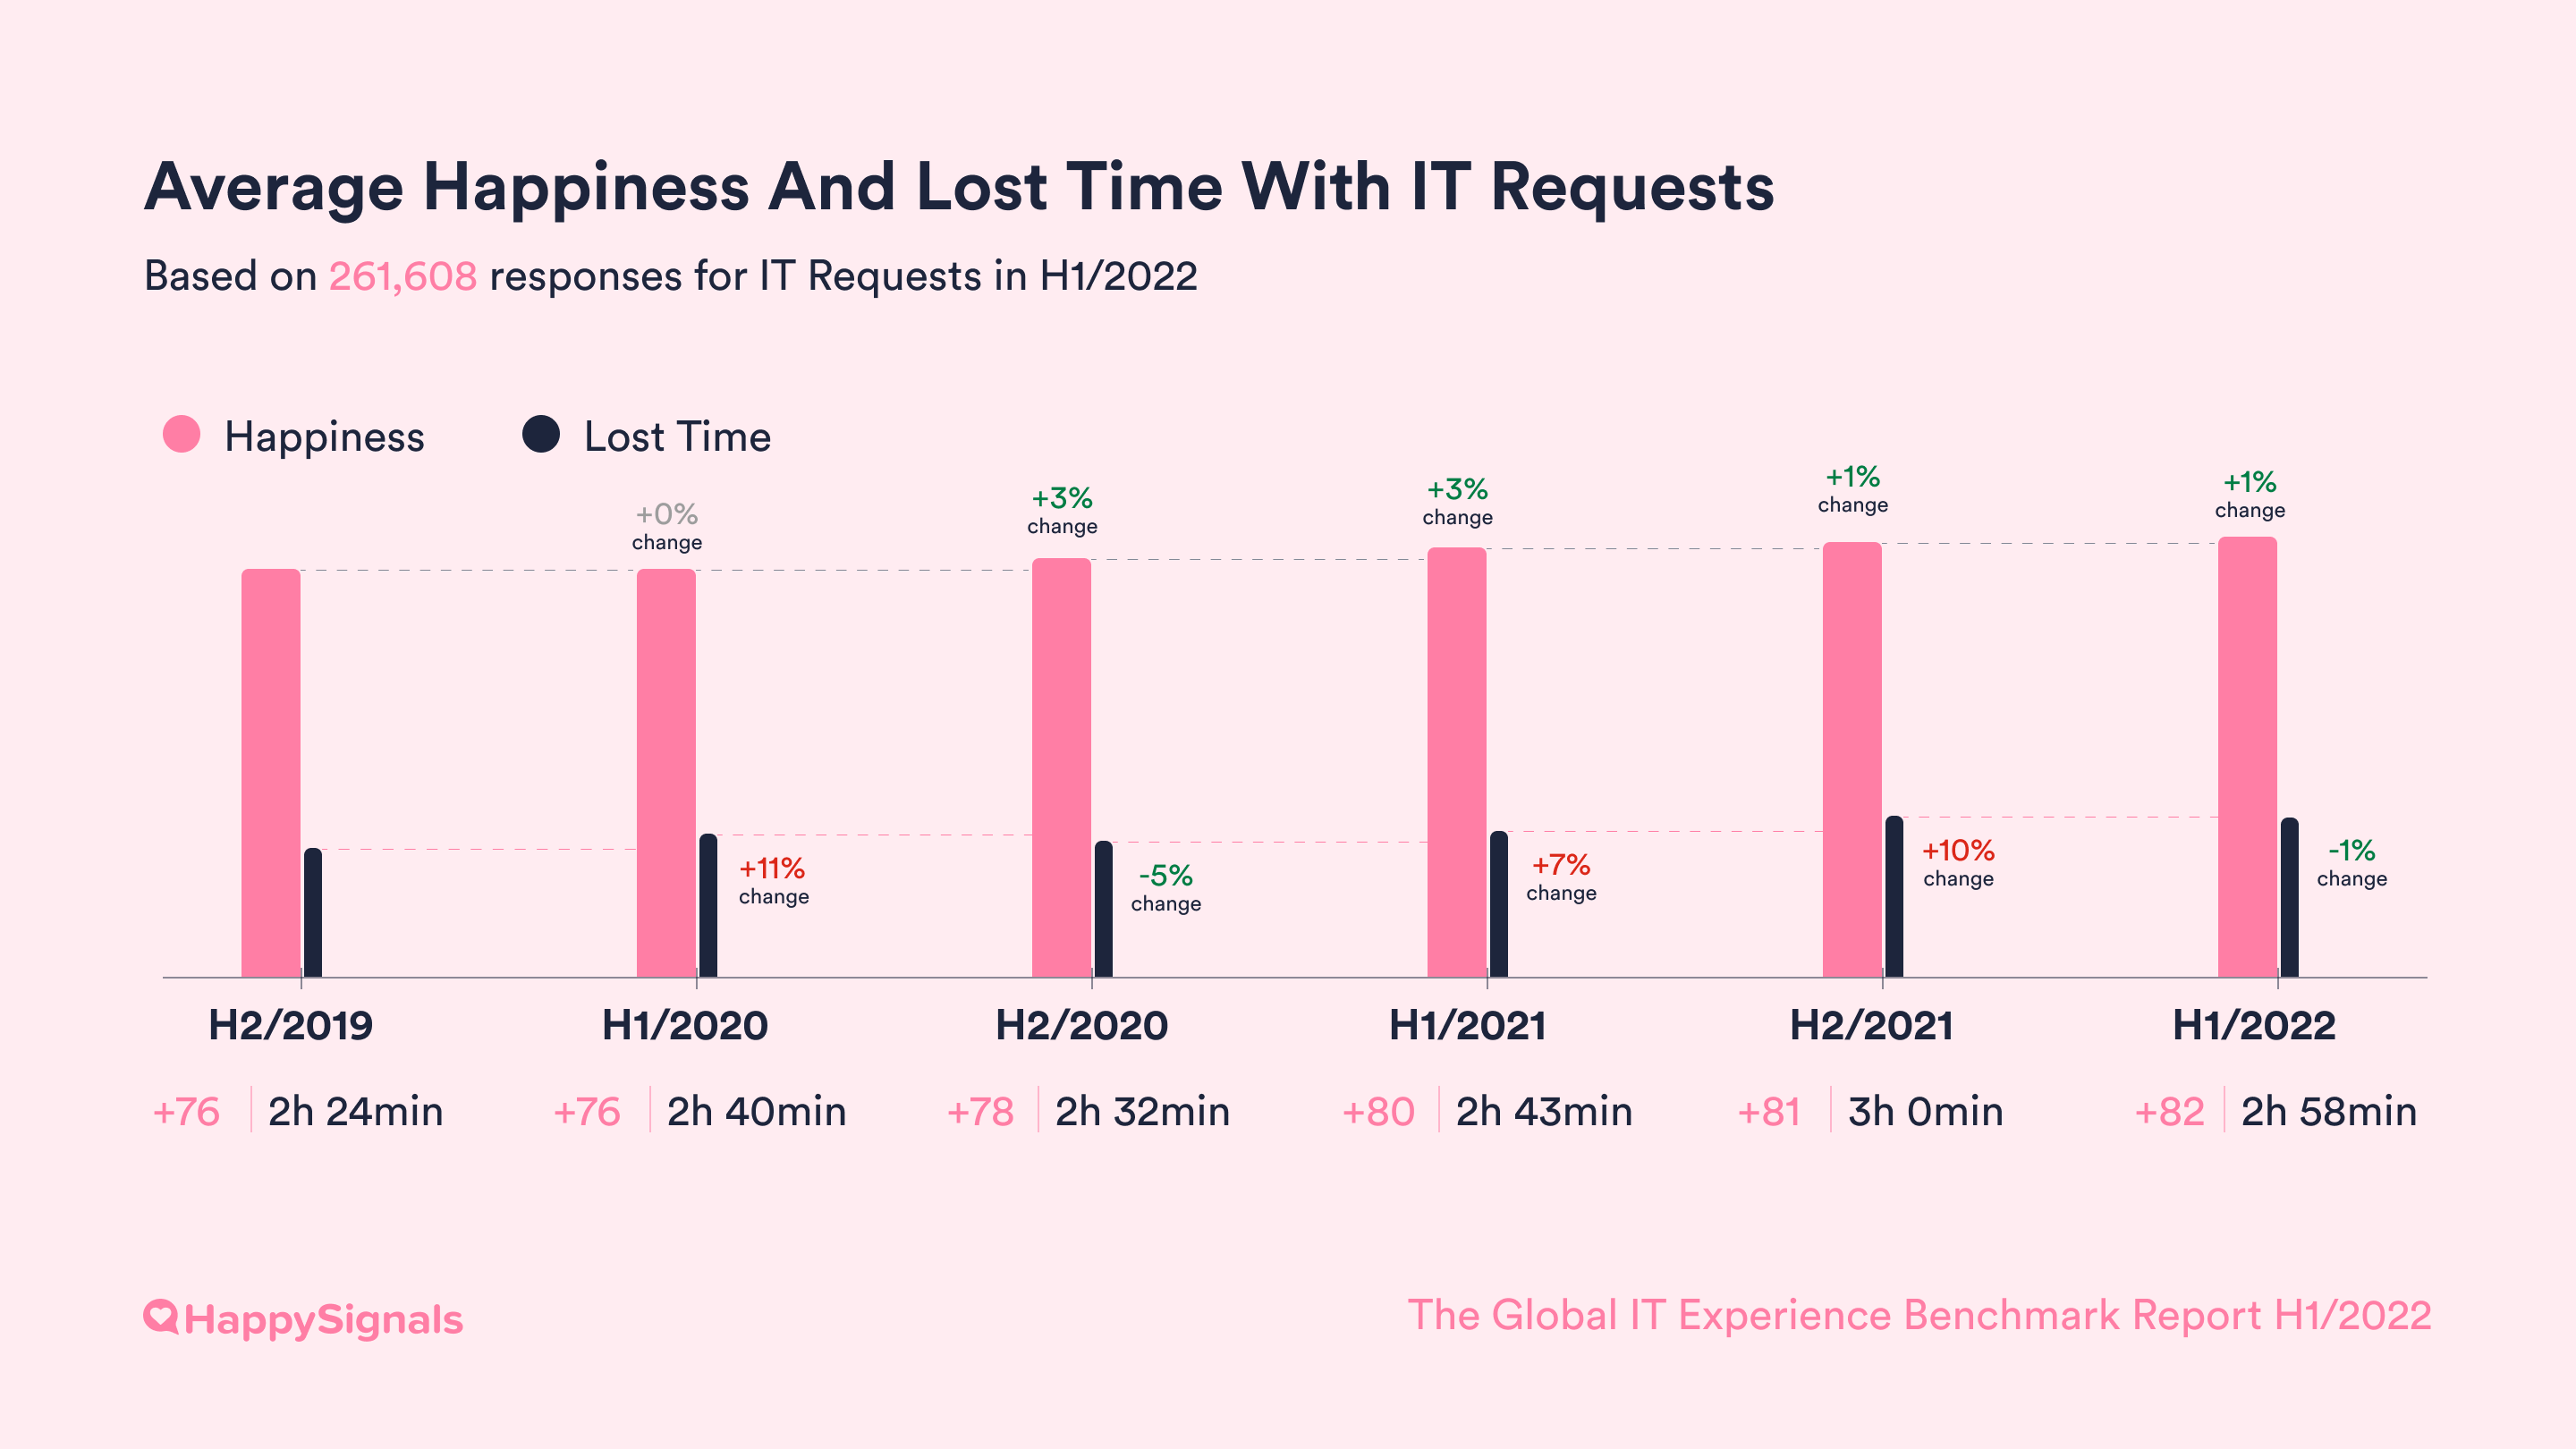
The saying “Technology changes, People stay the same” rings true in our data. The Factors that create positive, neutral and negative experiences with IT Requests for end-users remain very stable.
| IT Requests - Positive Factors | H2/2019 | H1/2020 | H2/2020 | H1/2021 | H2/2021 | H1/2022 |
| I was informed about the progress | 31% | 32% | 36% | 36% | 35% | 34% |
| Instructions were easy to understand | 29% | 31% | 31% | 31% | 32% | 32% |
| It was easy to describe what I wanted | 31% | 31% | 32% | 33% | 34% | 33% |
| Service personnel's attitude | 48% | 48% | 48% | 48% | 46% | 45% |
| Service personnel's skills | 46% | 46% | 46% | 45% | 44% | 44% |
| Speed of service | 79% | 78% | 79% | 80% | 80% | 80% |
| IT Requests - Neutral Factors | H2/2019 | H1/2020 | H2/2020 | H1/2021 | H2/2021 | H1/2022 |
| I had to explain my case several times | 15% | 15% | 16% | 15% | 14% | 15% |
| I wasn’t informed about the progress | 11% | 12% | 11% | 11% | 11% | 11% |
| Instructions were hard to understand | 8% | 7% | 9% | 8% | 7% | 7% |
| It was difficult to describe what I needed | 8% | 8% | 8% | 8% | 8% | 8% |
| It was difficult to know where to start | 11% | 11% | 11% | 12% | 11% | 11% |
| Service personnel's attitude | 5% | 4% | 4% | 6% | 5% | 5% |
| Service personnel's skills | 7% | 6% | 6% | 6% | 5% | 6% |
| Speed of service | 59% | 58% | 56% | 58% | 58% | 56% |
| IT Requests - Negative Factors | H2/2019 | H1/2020 | H2/2020 | H1/2021 | H2/2021 | H1/2022 |
| I had to explain my case several times | 32% | 32% | 30% | 31% | 30% | 30% |
| I wasn’t informed about the progress | 22% | 28% | 29% | 26% | 28% | 27% |
| Instructions were hard to understand | 12% | 11% | 12% | 11% | 11% | 11% |
| It was difficult to describe what I needed | 8% | 6% | 6% | 7% | 7% | 7% |
| It was difficult to know where to start | 10% | 10% | 11% | 10% | 10% | 10% |
| Service personnel's attitude | 8% | 8% | 9% | 8% | 8% | 8% |
| Service personnel's skills | 17% | 16% | 16% | 12% | 13% | 13% |
| Service was slow | 55% | 58% | 56% | 56% | 57% | 56% |
Company size can have an effect on how end-users rate IT services. In the smaller organizations, it is more likely that the IT Services are provided by internal IT teams. Among the companies that have 1,000-5,000 employees, only 33% have outsourced the first level of IT support. In larger organizations that have more than 5,000 employees, over 70% have outsourced first level IT support.
We have seen the gap getting eliminated between the smallest and largest organizations, with the largest organizations with more than 20,000 employees having significantly improved end-user IT Happiness. The largest organisations now achieve practically the same level of IT Happiness as the smallest ones.
The change reflects the faster speed of improvement among outsourced IT service providers, that are managing first-line IT support in nearly all of the largest organizations in our customer base. Internal service desks improve the experience on average by 19%, while outsourced IT service desks improve experience on average by 36%. See details in section 3.3.
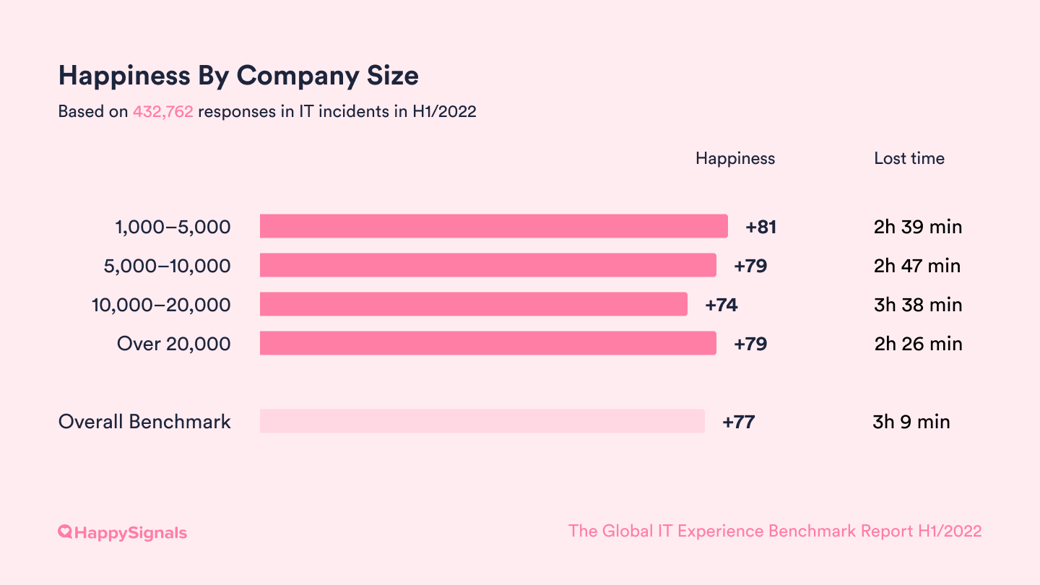
| Happiness by company size | H1/2021 | H2/2021 | H1/2022 |
| 1,000–5,000 employees | +81 | +78 | +81 |
| 5,000–10,000 employees | +79 | +78 | +79 |
| 10,000–20,000 employees | +72 | +72 | +74 |
| More than 20,000 employees | +69 | +73 | +79 |
This is the third report in which we are releasing any information about the differences between industries. We still do this with caution, as we know that there are many factors apart from industry that can influence end-user happiness with IT.
We derived the Happiness scores for comparing between industries by creating a weighted average that eliminates non-industry-specific differences in end-users’ happiness ratings.
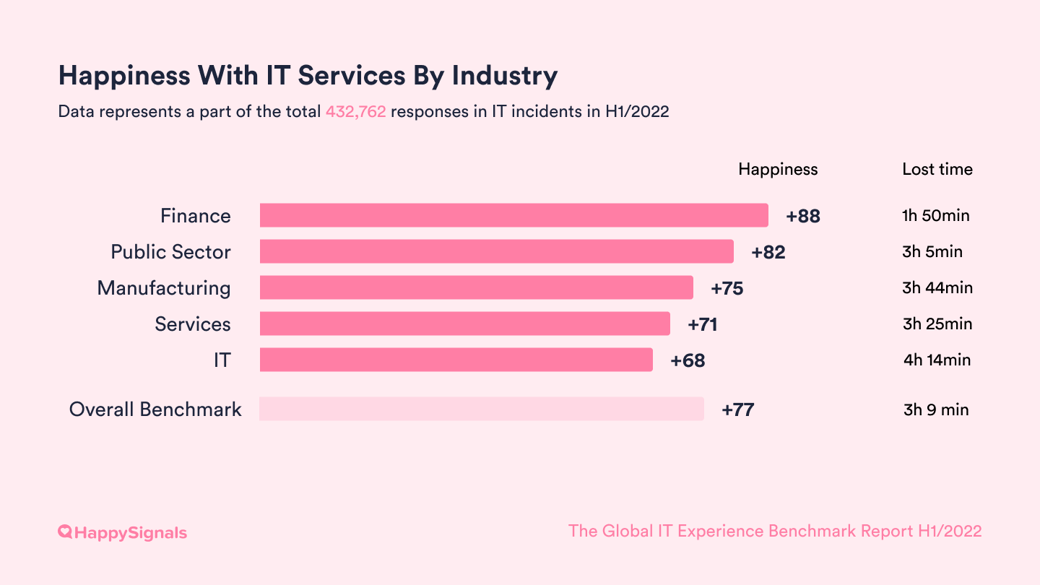
End-users in finance are 26% happier with IT services than end-users in IT companies. Finance is among the most regulated industries and IT happiness might reflect stability of processes and ways of working. It is also the sector where the expression "time is money" is most likely to ring true as a core value. The perception of lost time with IT incidents in Finance is significantly lower than any of the other industries in the selected industries.
The fact that end-users in IT companies are the most demanding does not come as a huge surprise. Employees in IT companies are more likely to be technically-skilled Doers who can solve simpler IT issues by themselves. Hence, they go to IT support with more complex problems, and have more demanding expectations of the resolution process. This is reflected by the highest amount of perceived lost time with IT incidents in any of our industry verticals.
What is the business impact of ITXM in different industries?Different industries have end-users with varying levels of tech skills and preferences. If your end-users are highly skilled with technology, they are more likely to solve easy issues themselves, but bring more complex issues for IT to solve. Using industry data is one aspect that gives higher level perspective of happiness, but is best understood when combined with other benchmarks like your share of different IT Support Profiles and country specific differences in rating IT services - which we also cover in our report. |
HappySignals tracks how different organizations who use our platform are able to improve end-user experiences through experience management. We do this by comparing end-user happiness in our customers’ first two months of using HappySignals (baseline before they have made any improvements), with the happiness now.
While internal IT service desks start at higher levels of happiness, outsourced IT on average manage to improve the experience more. Our latest data shows that internal service desks have improved IT happiness by 19%, while outsourced service desks have increased the happiness by 36%.
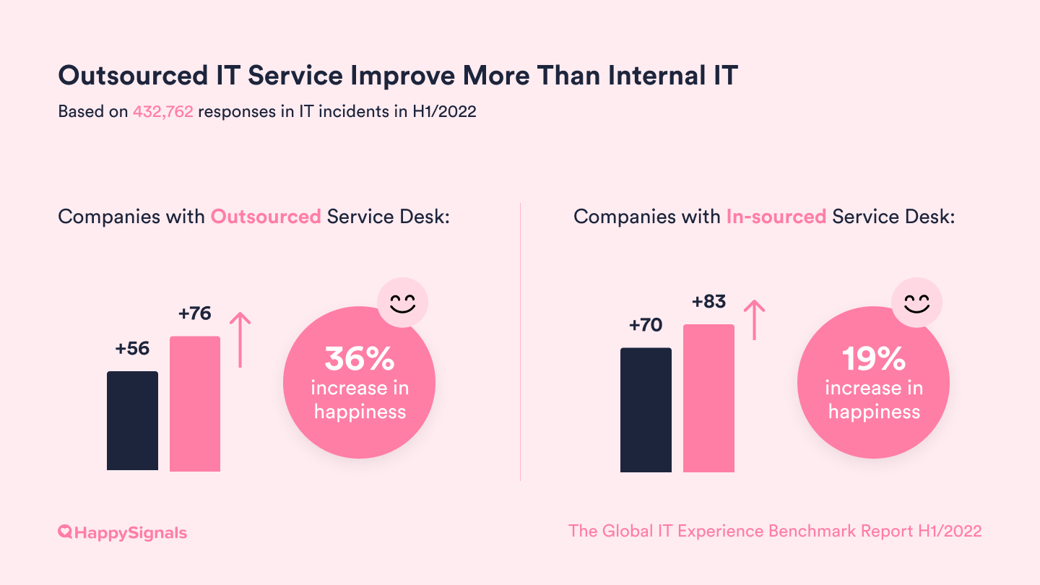
Keep in mind however, that this report is only based on data from HappySignals customers. In our customer base the bigger the organization, the more likely it is that the organization has outsourced their service desk:
Business impact of ITXM in Outsourced IT Provider relations?Experience Management does not mean you need more people. It means provider and customer can together allocate resources to areas where they create the most value. Using IT Experience Management practices in Outsourced IT provider relations provides a shared view of IT experience between the enterprise and the IT provider. This leads to a shift in focus from SLAs to end-users. |
Like in previous reports, we continue to observe cultural differences in how end-users perceive IT services and lost time. For example, end-users in Western Europe rate IT Services lower than Eastern Europe, despite reporting less lost time with Ticket-based IT.
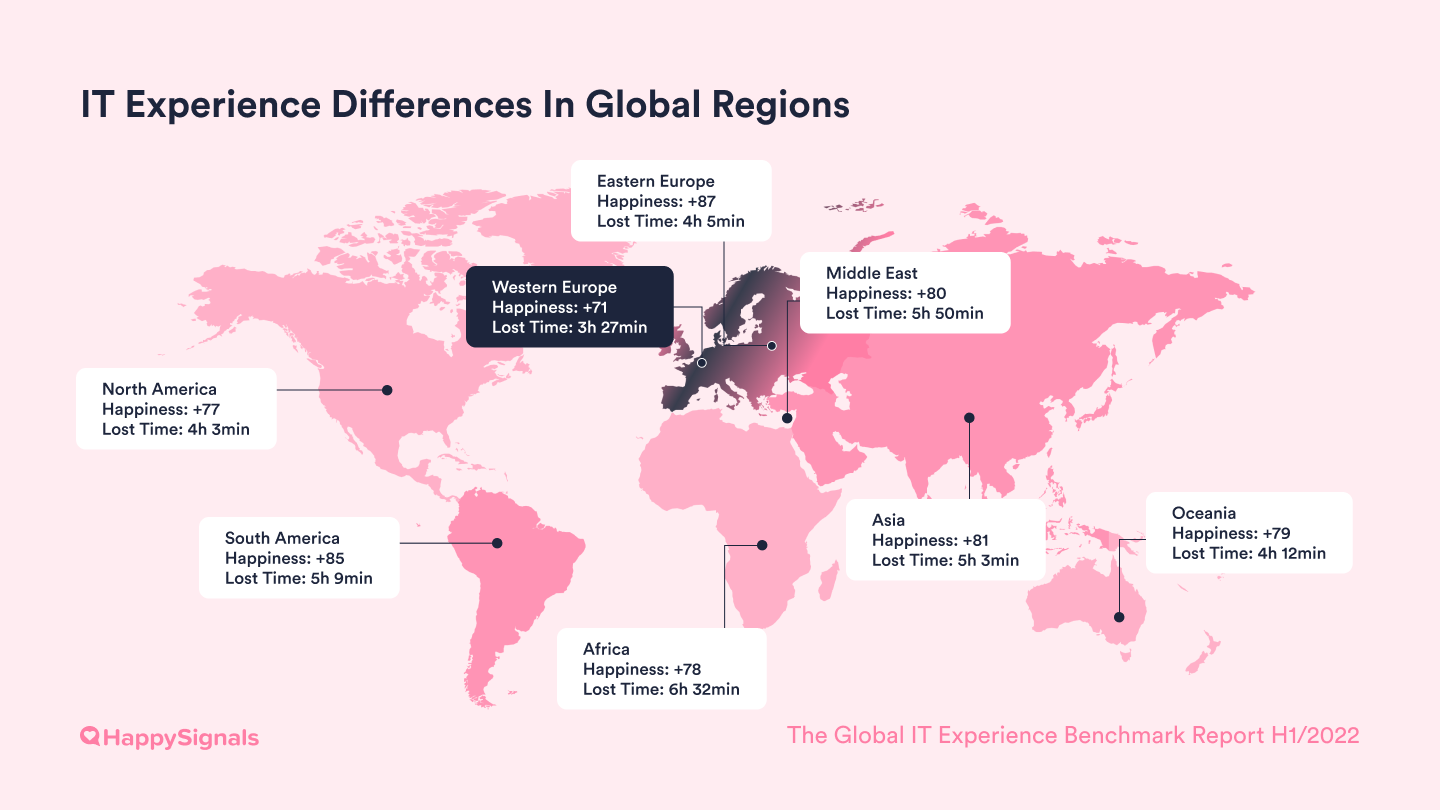
This region-specific data tells an interesting story: The happiest countries are also the countries that report the highest time losses with ticket-based IT.
To us, this underlines the fact that end-users in some cultural contexts are more demanding and expect faster service than in others.
Book a meeting with the report authors, if you wish to discuss country specific differences.
| Happiest Regions | Happiness | Lost time |
| Eastern Europe | +87 | 4h 5min |
| South America | +85 | 5h 9min |
| Asia | +81 | 5h 3min |
| Least Happy Regions | Happiness | Lost time |
| Western Europe | +71 | 3h 27min |
| North America | +77 | 4h 3min |
| Africa | +78 | 6h 32min |
What is the business impact of ITXM when considering cultural differences?There are notable differences in end-user rating behavior between different countries. Understanding these cultural-specific rating differences will help you to understand your end-users’ happiness levels and experience data in context. More broadly, if your end-users’ happiness deviates from the country benchmark by more than 5%, you are either doing something extremely well or have areas for improvement. A very practical implication of having Benchmark data from different countries is being able to conduct productive conversations with business stakeholders, when the absolute numbers in certain countries differ from the norm. Less gut feelings, and more reliable and repeatable data to support the analysis of where and how to improve. |
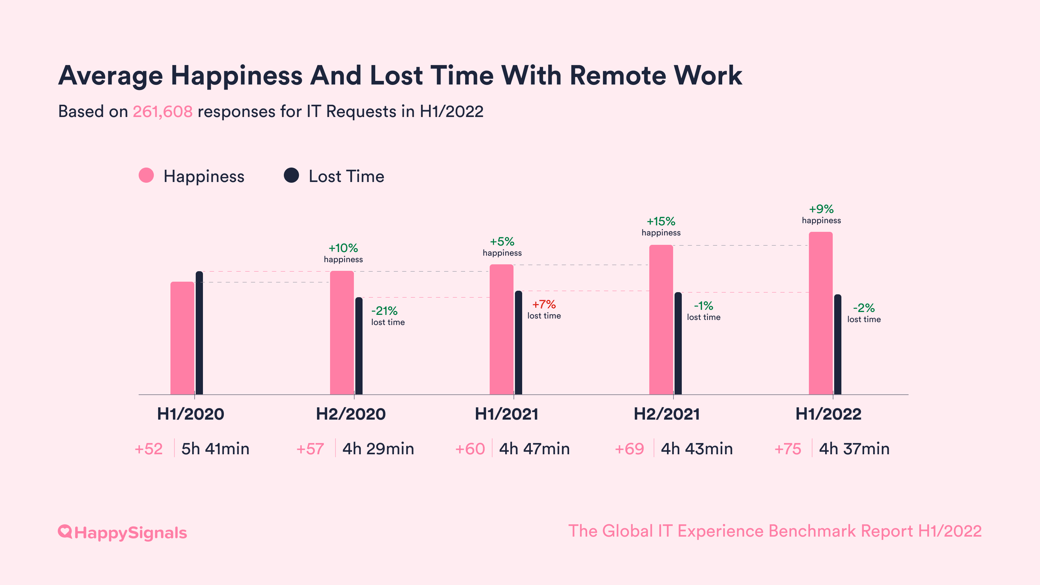
Enterprises continue to get better at supporting employees in remote work. Happiness with Remote Work increased from +60 to +75 over the past year.
However, we cannot make direct comparisons between the factors influencing happiness with Remote Work in H1/2021 and H2/2021 in this report. This is because HappySignals changed the factors included in our Remote Work survey in H1/2021.
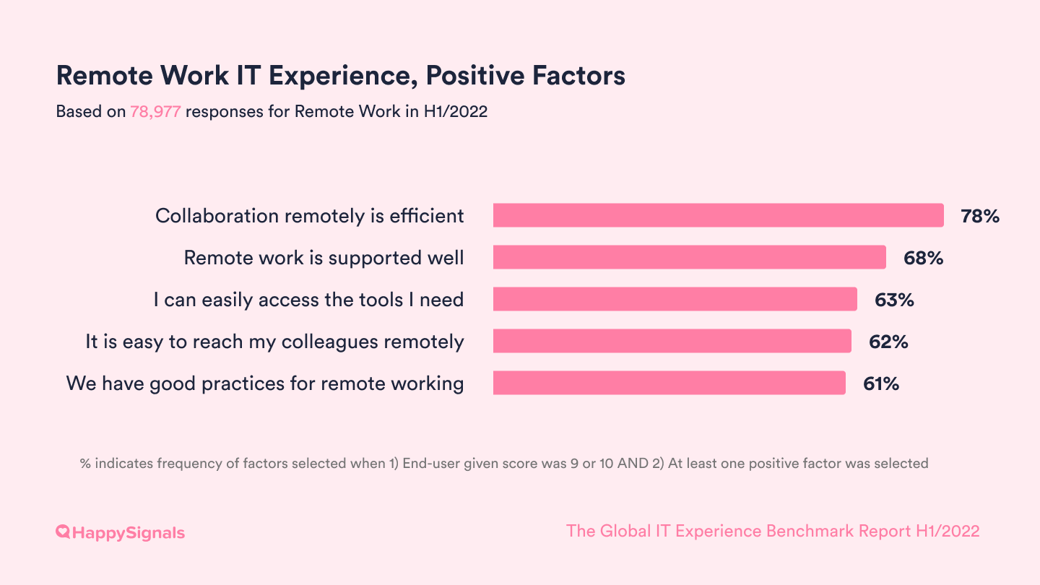
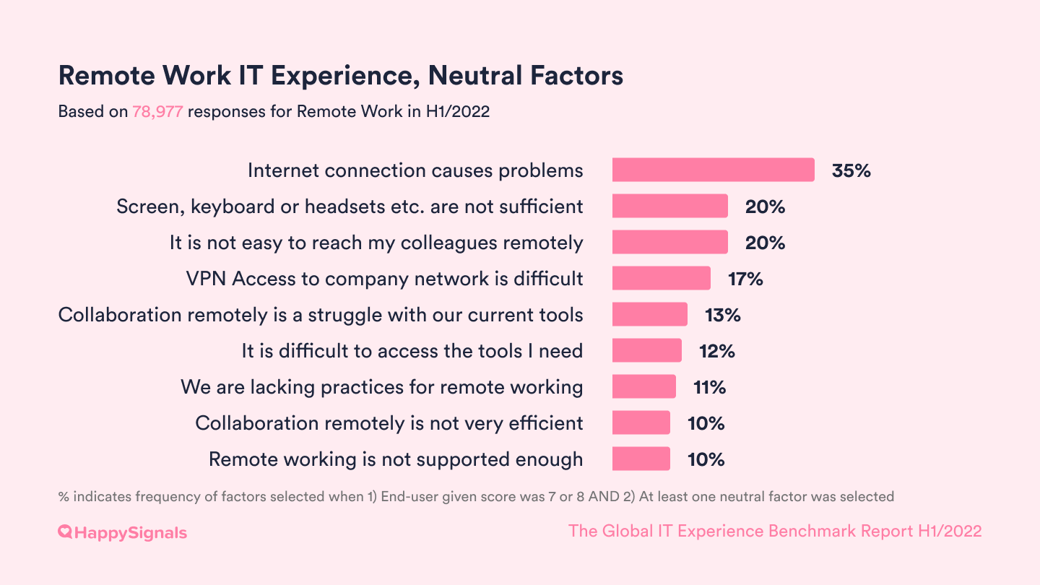
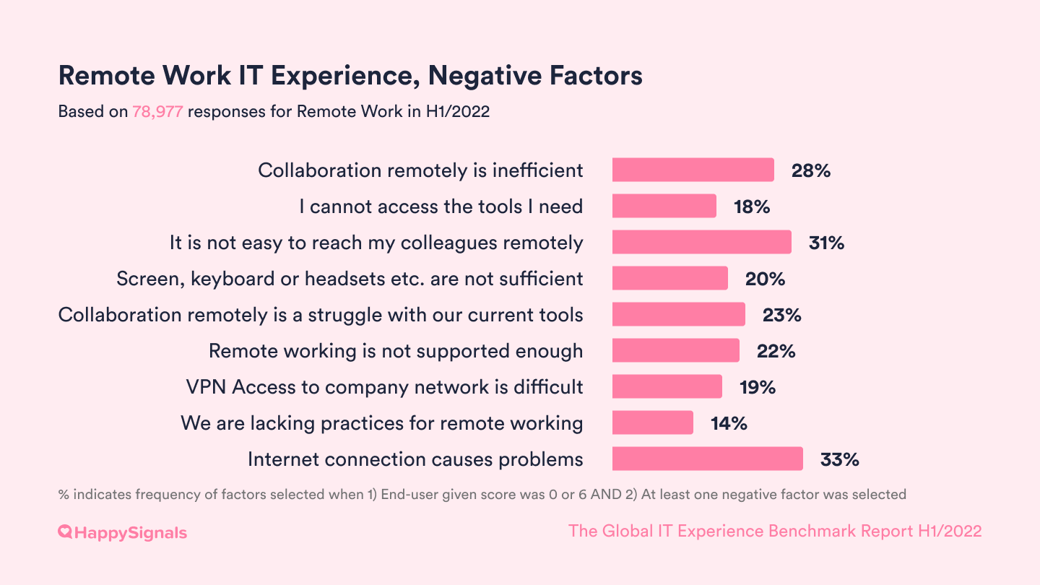
Looking only at the H2/2021 data however, end-users made more evenly distributed selections between the given Remote Work factors, as compared to for Ticket-based IT. In other words, no specific factors stand out as dominant influencers of end-user happiness or unhappiness with remote work.
What is the business impact of ITXM for Remote Work?While remote work is now normalized in most locations, IT teams can use Experience Data to find pockets of improvement with remote work, to provide equal collaboration opportunities for all employees. There is no one-size-fits-all approach to how Enterprise IT can optimize remote work for your organization. The only way to find out is by collecting data directly from your own end-users. Employees may have different needs in different locations and services. Maybe employees use shared end-points, or work in areas where the internet access and cultural differences make remote work more or less challenging. Having real feedback from employees across locations is critical in making Remote Work productive for all employees. |


Ready to get started?