

The Happiness Score™ report provides insights on the state of Enterprise IT Experiences across all IT touchpoints, based on almost 1.151.269 responses between 1. July 2021 and 31. Dec 2021.
Download as PDF
Introducing the Global IT Experience Benchmark.
The H2/2021 report now includes data and insights across all touchpoints with IT.
The report is based on continuous data collection through the HappySignals Experience Management Platform for IT.
In total, there were 1,151,269 end-user responses from our Enterprise customers between July 2020 to Dec 2021.


If a company has less than 5000 employees, their happiness is on average about 12 points higher than companies with more than 20,000 employees.
Based on 423,510 responses for IT incidents

The difference in IT end-user happiness between the happiest and unhappiest industries is marginal – only 12%.
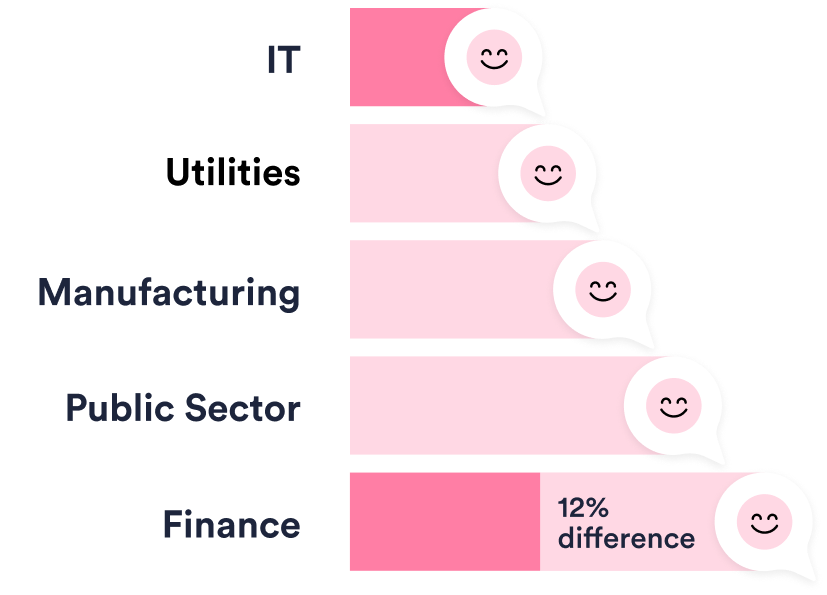
Based on 423,510 responses for IT incidents
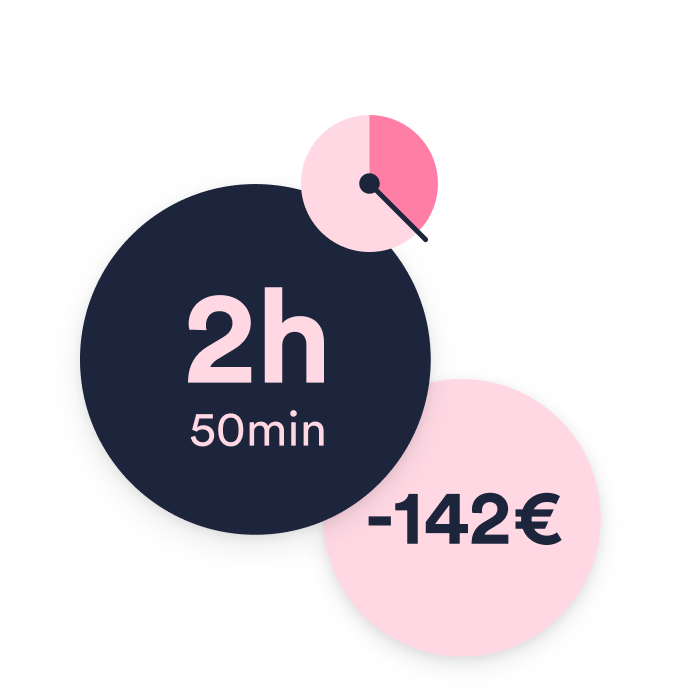
The perception of lost time increases by roughly +1.5h every time a ticket is reassigned
The faster you can get the ticket to a team or individual that can solve the ticket, the better is the end-user experience.
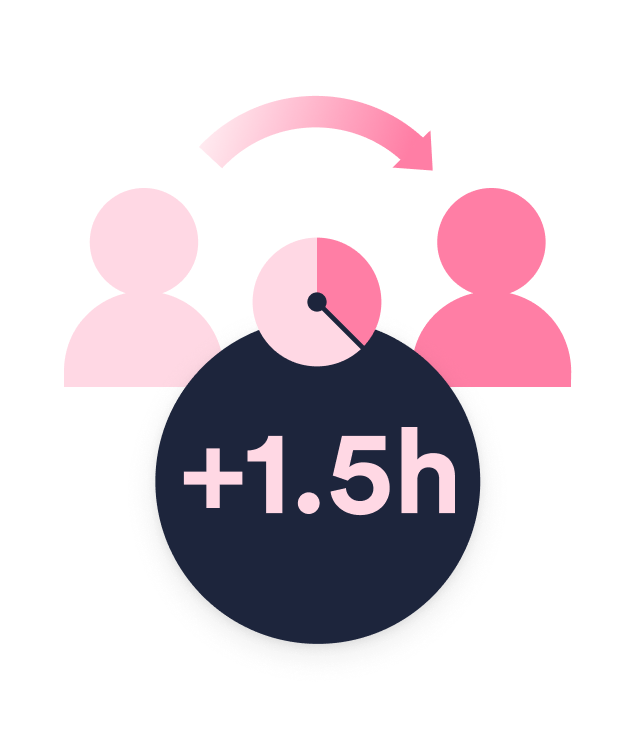
Based on 423,510 responses for IT incidents
One reason is that External IT providers often have better processes for using experience data in their daily work.
As a result, external IT Service Desks have almost caught up with internal ones in overall happiness.
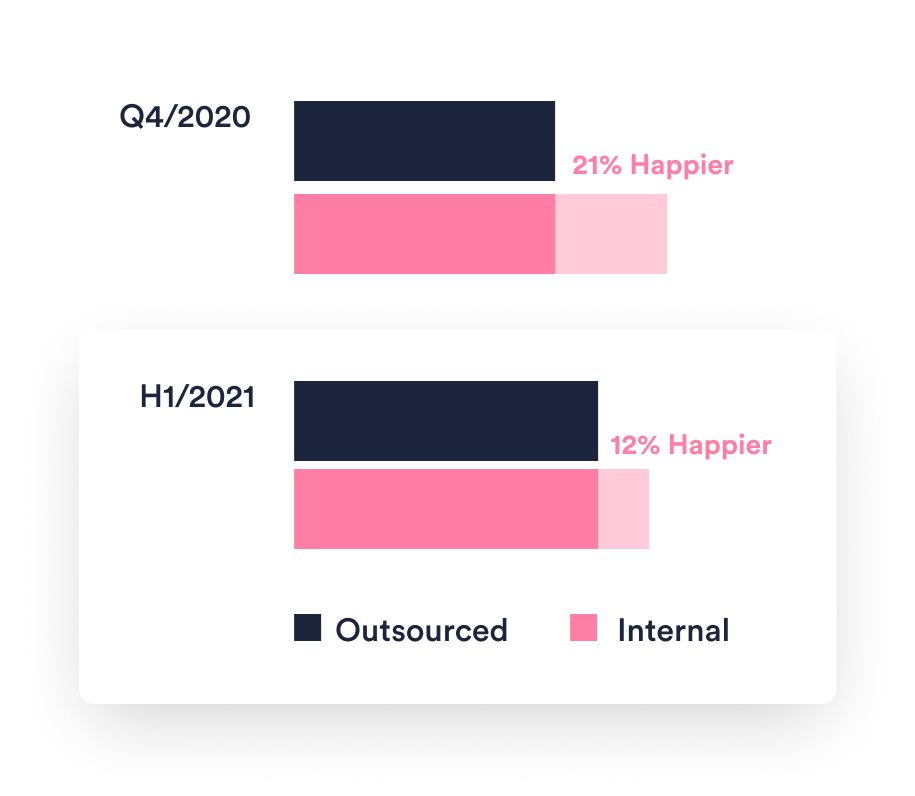
Based on 423,510 responses for IT incidents
In bigger companies with more than 5000 employees, the outsourced IT Service desk is just as good or better than an internal service desk.
Read more about internal vs outsourced IT
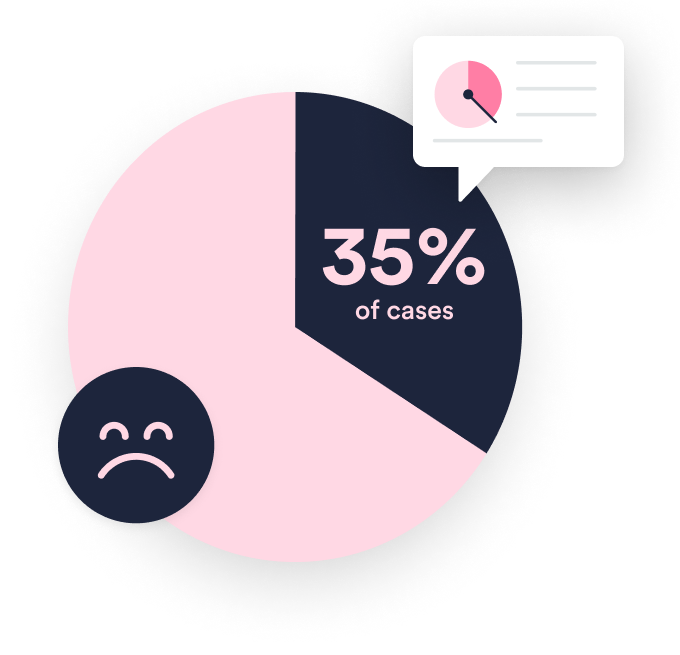
Based on 395,500 responses for IT incidents

During the Covid-19 year, the happiness of end-users with IT Support Services has continued to increase.
The average end-user happiness among HappySignals customers in May 2021 is at a record high of +75, a 13% increase from Q4/2020.
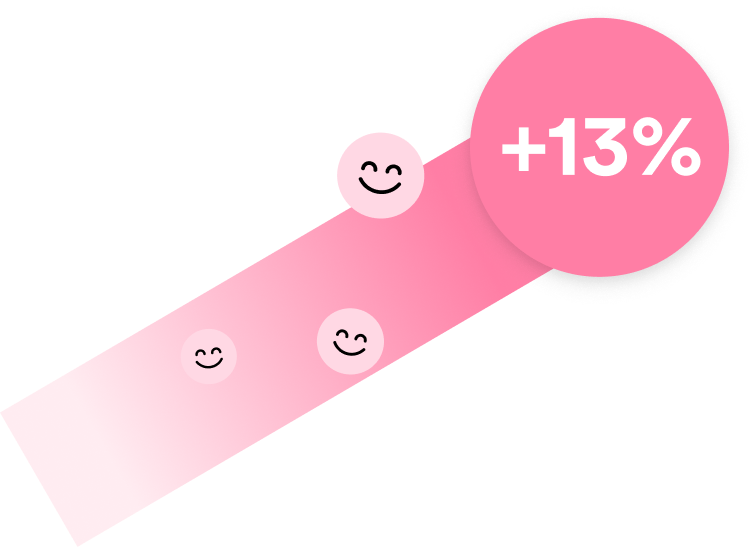
Based on 423,510 responses for IT incidents

At an hourly rate of 50€, the perceived productivity loss equals 142€ in business value.
P.S. End-users do not stop the clock while waiting!
Based on 423,510 responses for IT incidents

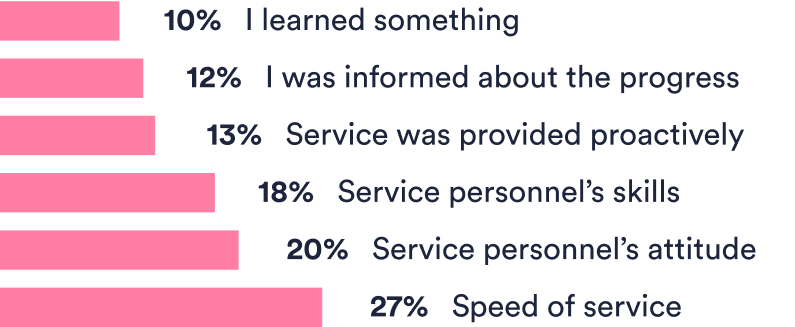
When end-users give IT incident resolutions a high score (9-10 out of 10), the top reasons are the speed of service and human aspects related to the service agent's attitude and skills.
Based on 423,510 responses for IT incidents
Speed of service is by far the most cited factor when end-users give a neutral score (7-8 out of 10).
Based on 423,510 responses for IT incidents
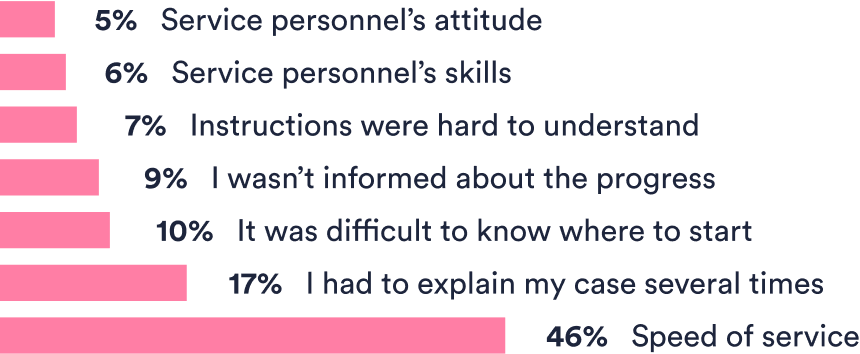
When end-users give negative scores (0-6 out of 10), the factors are often linked to the resolution process.
Ticket not being solved and having to explain the case several times may hint at ticket reassignments and prematurely closed tickets.
.svg)
Based on 423,510 responses for IT incidents

Now in H1/2021, one year after companies going remote, the number of requests have returned to pre Covid-19 levels
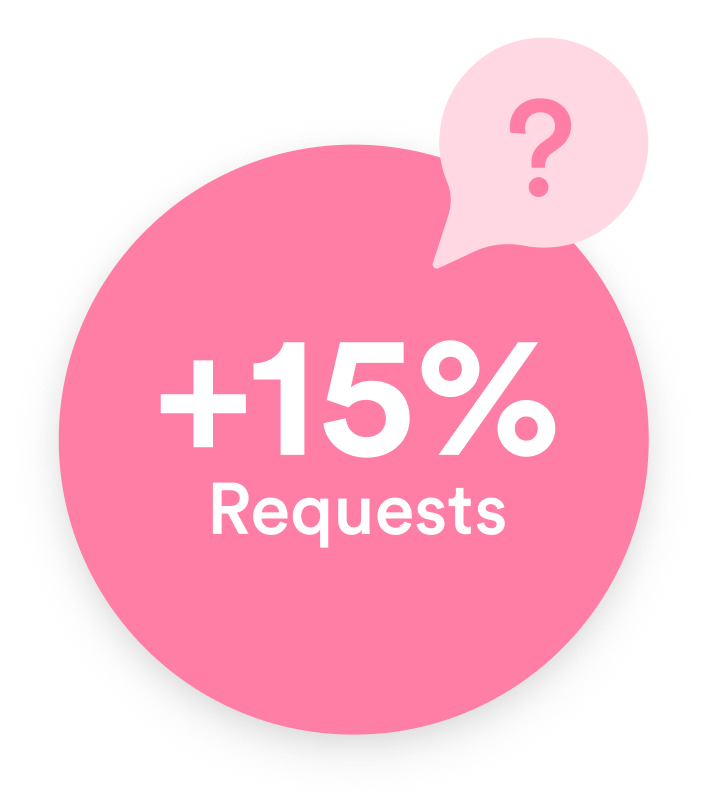
Based on 218,941 responses for IT requests
When end-users give IT request resolutions a high score (9-10 out of 10), the top reasons cited are speed of service, service personnel’s skills and attitude.

Based on 218,941 responses for IT Requests
The top 2 neutral factors are the same as top 2 negative factors, related to speed of service and having to explain case several times.

Based on 218,941 responses for IT Requests
When end-users submit IT requests, negative scores are likely if the service is slow and they have to explain the request several times.

Based on 218,941 responses for IT Requests
The most common reason for end-users to give a negative score for IT requests is slow service
Based on 218,941 responses for IT requests
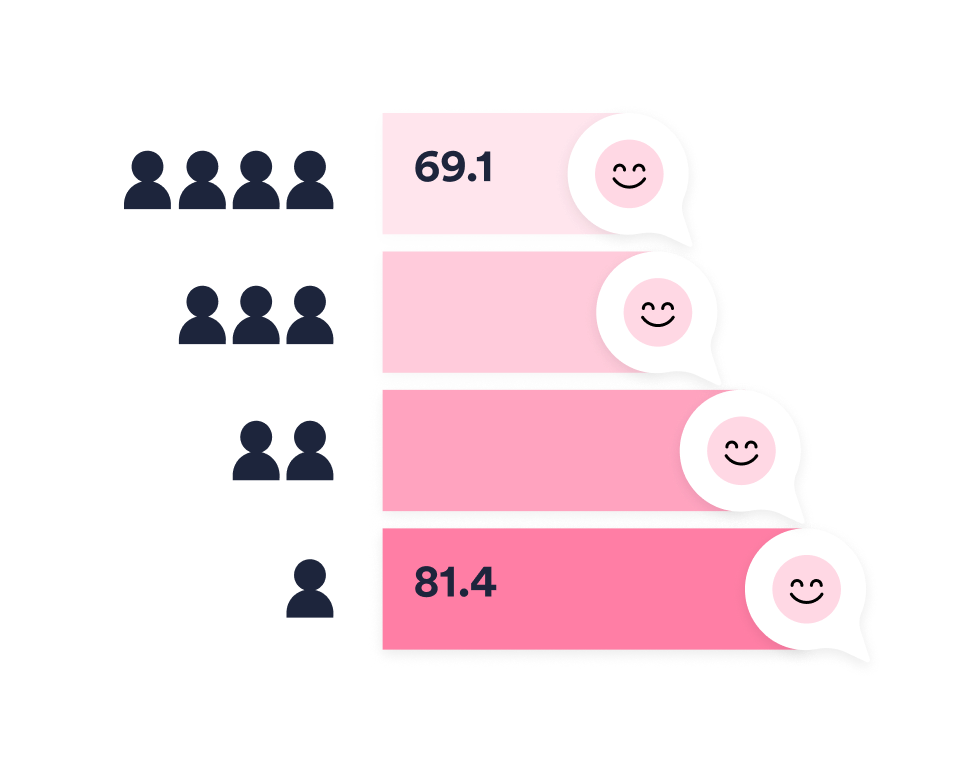
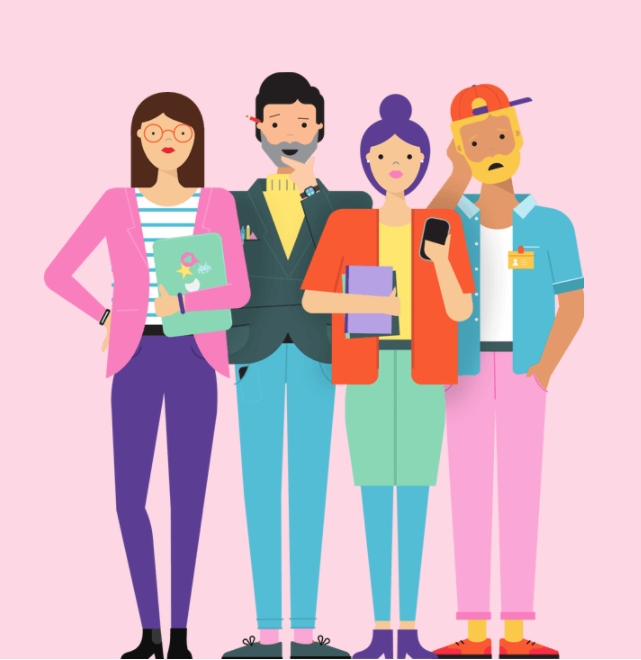
HappySignals captures 4 distinct types of IT end-user support profiles - Doer, Prioritiser, Supported, and Trier.
Each profile has different needs and wants when interacting with IT support and services.
Doers are capable of solving IT-related problems themselves. People often ask Doers for help. Sometimes Doers will even try to teach others to solve problems themselves. Hence when asking for support, Doers want expert help.
Guide on using Support Profiles in IT Service Desk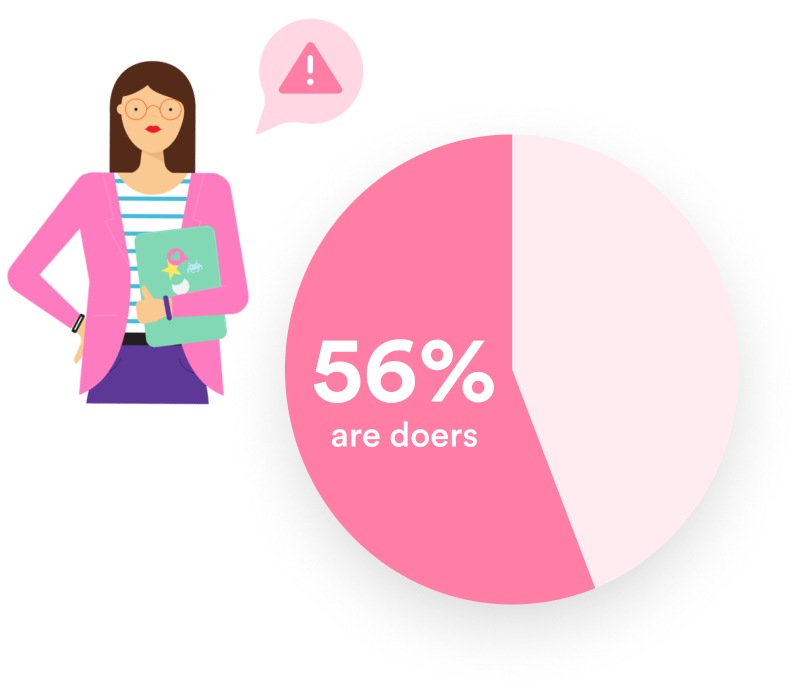
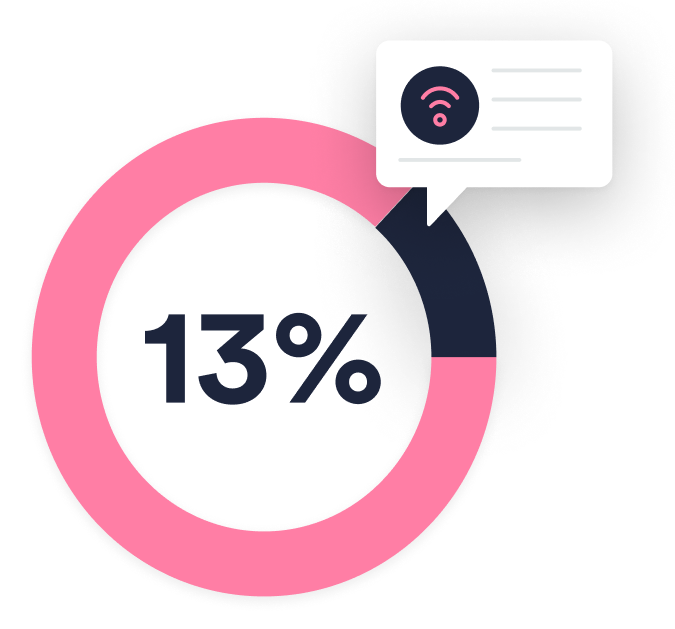
8% more untechnical people (Supported and Triers) contacted IT Service Desks during the pandemic than before.
We believe this is because peer support is not as readily accessible as it was when everybody was in the office together.

Based on 423,510 responses for IT incidents
Service Personnels' skills and attitude, alongside speed of service, have consistently been the most commonly linked factors for a good score.
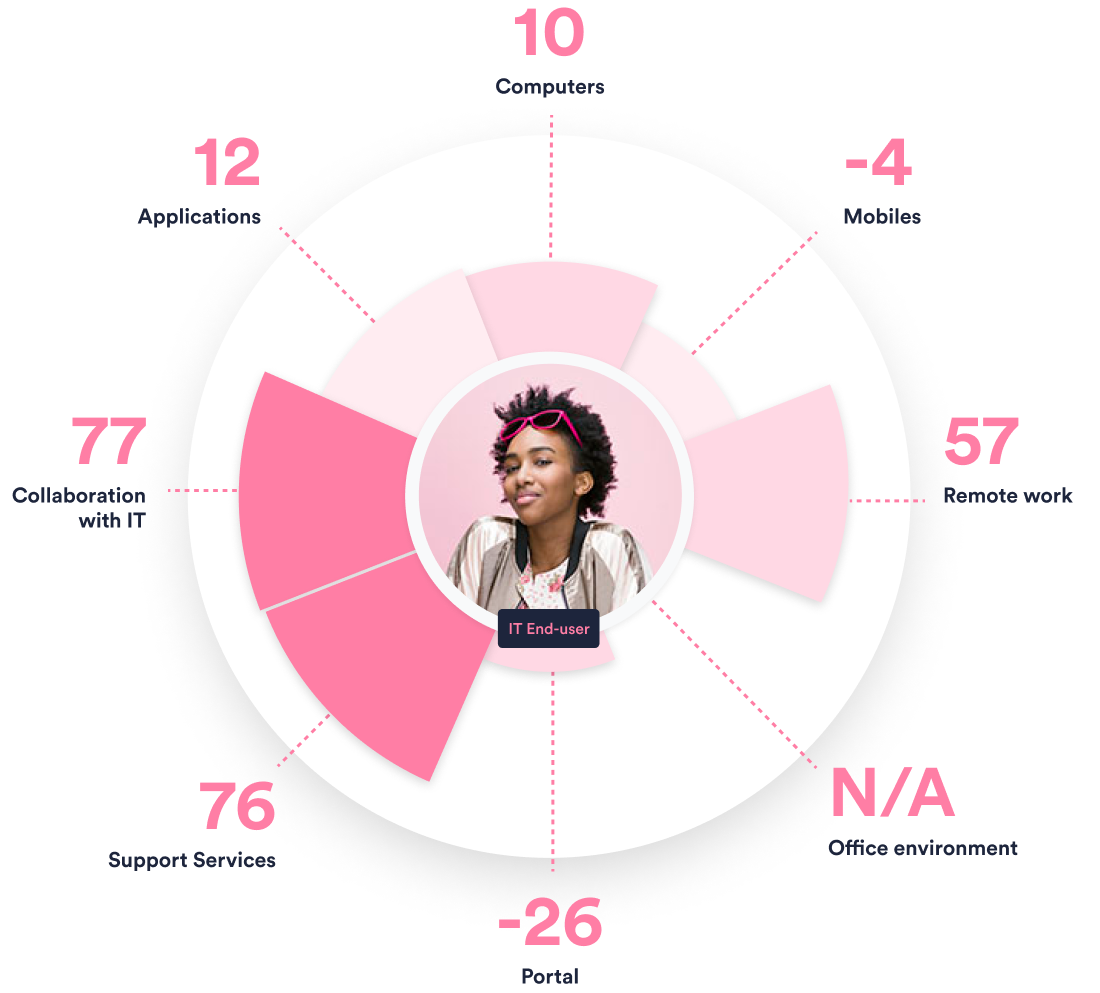
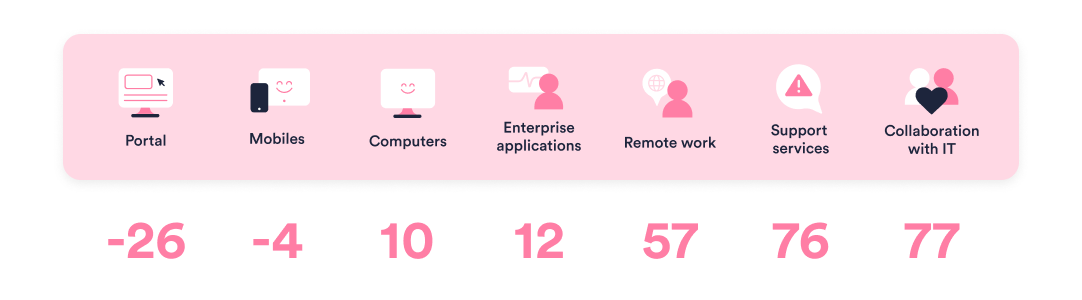
That human touch is visible when comparing end-user happiness across all measured IT touchpoints.


Top factors for end-users to be happy with remote work are related to interpersonal aspects

Top 3 factors for neutral feedback are the same as they are for negative feedback

The reasons for negative feedback in relation to remote work have slightly changed since the first half of 2020 but connection issues and workspace ergonomics are still on the top.

Based on 120,409 responses on remote work

Based on 120,409 end-user responses


