

The Common Continual Improvement Opportunities Identified Through Experience Data
This blog shares some of the findings from The Global IT Experience Benchmark report and what these mean in continual improvement terms.

When an organization aims to instill a culture of continual improvement, it’ll usually adopt formal improvement processes – perhaps from the ITIL 4 Continual Improvement practice – and identify sources for improvement identification. These sources might range from the use of a “suggestion box,” through the collection of issues raised in service review meetings or called out in customer satisfaction (CSAT) questionnaires, to the analysis of the data in the corporate IT service management (ITSM) tool. All of these sources might offer up good improvement opportunities, but there’s a danger that these are:
- Based on the IT view of what’s not working well
- Filtered – where someone who isn’t directly impacted is deciding what matters most
- Biased based on “who’s shouting loudest”
- Prioritized incorrectly
Plus, some issues are never identified, and end-users continue to suffer their adverse impact.
This is where experience data helps. It identifies the issues, highlights the contributing factors (and sometimes the root causes), and focuses on what matters most to end-users. To demonstrate this, this blog shares some of the findings from The Global IT Experience Benchmark report and what these mean in continual improvement terms.
Explaining the experience data shared in this blog
The Global IT Experience Benchmark H2/2022, released in February 2023, is a biannual Happiness Score™ report that shares a snapshot of Enterprise IT experiences over six months. The data is based on 1,642,555 end-user responses in enterprises that use the HappySignals IT Experience Management Platform. So, the data relates to organizations already addressing their experience-related issues rather than an average organization. Importantly, the insights into how end-users experience IT are reported by the end-users themselves – reflecting their feelings and perceptions about IT.
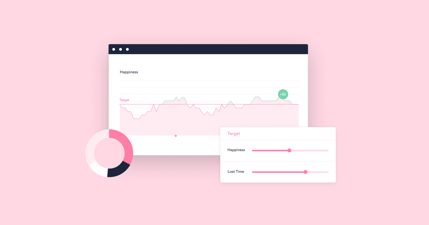
HappySignals surveys ask questions related to:
- Happiness: end-users rate how happy they are with the measured IT area (e.g. recent ticket-based service experience, Enterprise Applications, Mobile Devices, etc.) on a scale from 0-10. HappySignals then use the NPS model to derive the Happiness rating.
- Productivity: end-users estimate how much work time they lost, i.e. productivity, due to the measured IT area.
End-users can also select the various Factors – from a list of suggested reasons – that influenced their Happiness rating.
Using experience data to identify improvement opportunities beyond IT support
There’s so much insight in the aggregated experience data. Still, please remember that your organization’s experience data will drive its continual improvement efforts, not these aggregated views. The areas might differ, and your end-users will have different opinions on what matters most.
Let’s start with the Happiness with IT services, capabilities, and engagements. The chart below shows the average Happiness levels across various measurement areas:
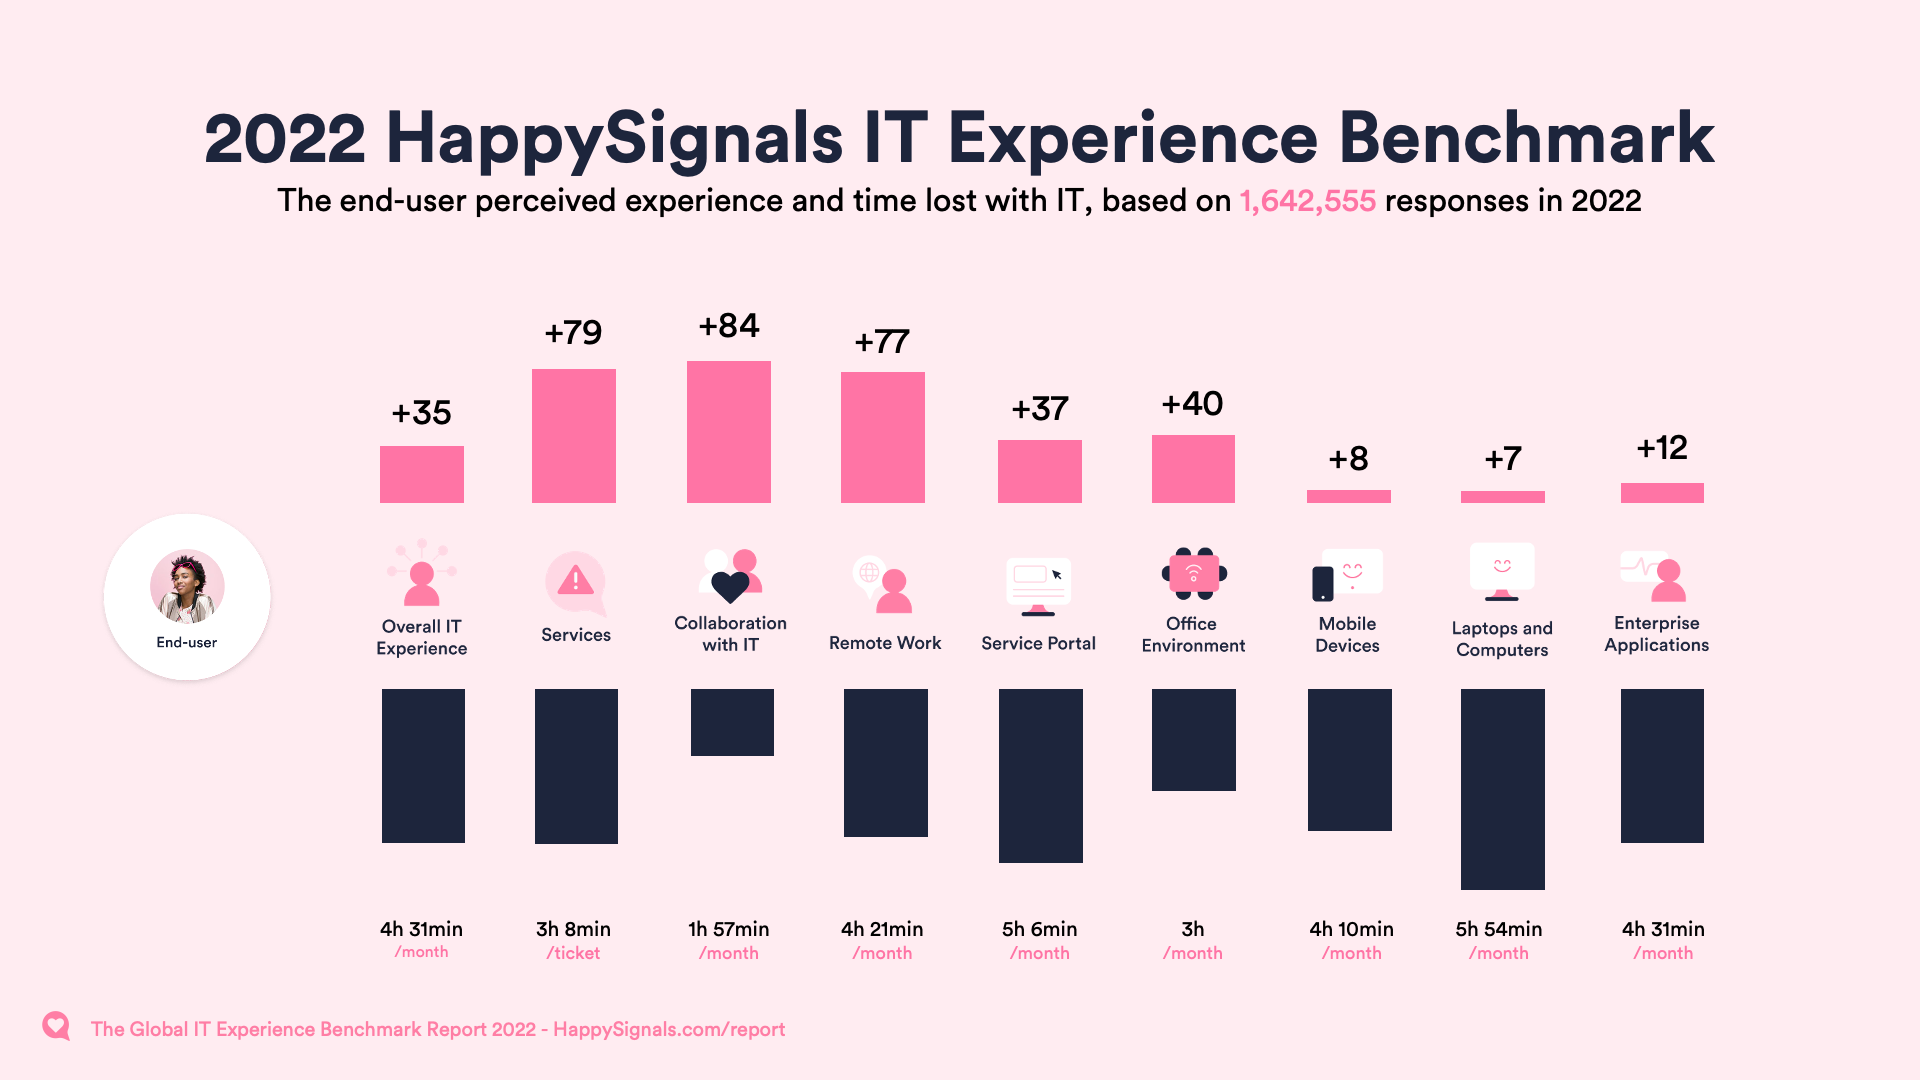
So, for example, if your continual improvement efforts focus on the IT service desk and incident management, you’re likely missing many of the issues your end-users are experiencing with other areas of IT service delivery.
Importantly, and I know I’ve already called it out, these Happiness figures are for our customers who are already investing in experience-related improvements. Your organization’s current situation might not benefit from the focused improvements that these customers have already made.
Measuring the benefits of focused, experience-related improvements
Hopefully, your organization will have its own benefits quantification mechanism for its continual improvement efforts, but the experience measurement data adds to this. Highlighting the increase in employee Happiness (as shown in the chart below) and the reduction in employee lost productivity that results from the focus on experiences.
Let’s start with these Happiness figures, where the average increases for customers from their first two months of using HappySignals are:
- 56 to 74 (a 33% increase) for companies with an Outsourced IT Service Desk
- 76 to 84 (an 11% increase) for companies with an In-sourced IT Service Desk.
To provide greater insight into these improvement figures, in our customer base the larger the organization, the more likely it is to have outsourced its IT Service Desk:
- Among companies with fewer than 5000 employees, only 33% have outsourced their IT Service Desk.
- Among companies with more than 5000 employees, 73% have outsourced their IT Service Desk.
Leveraging productivity data to drive continual improvement
The Happiness data is important, but many organizations will still want to quantify the “fruits of their labor” financially. This need is where the end-user perception of lost productivity helps.
The chart below shows how employee lost productivity for incidents differs by IT support channel. Again please remember that this is for organizations already investing in experience-related continual improvement.
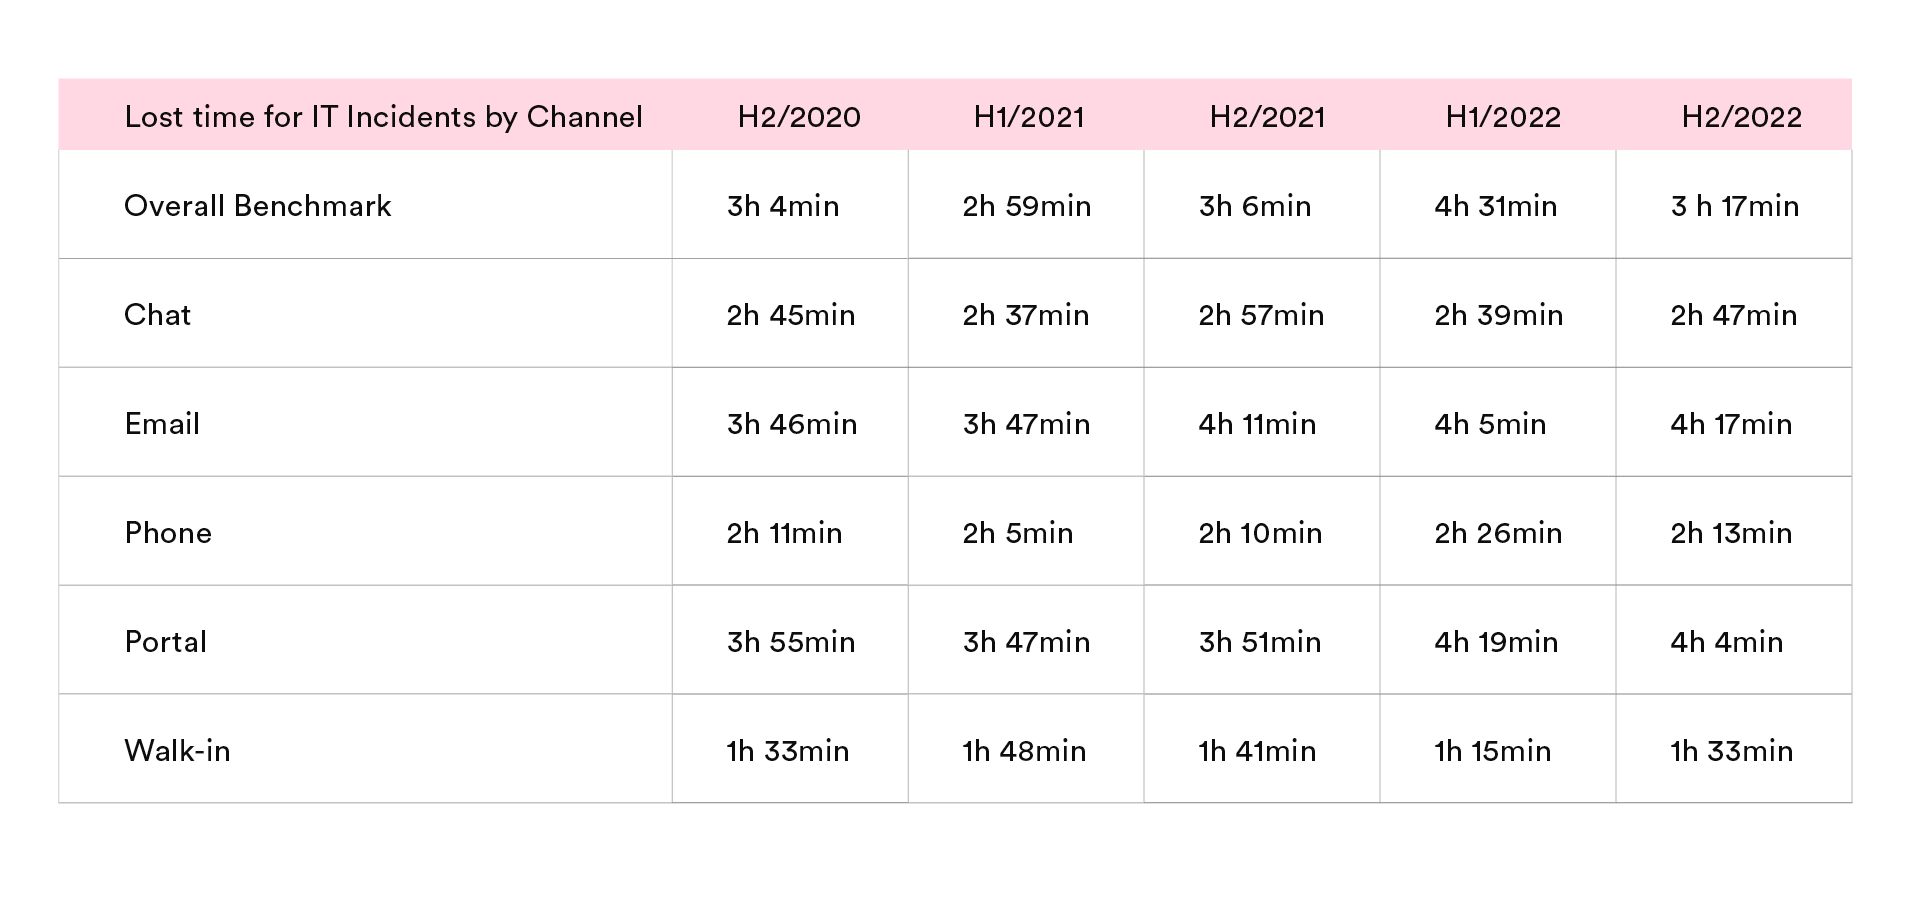
This channel-based data shows that, on average, employees lose 78% more productivity by using the corporate IT self-service portal rather than the telephone channel. An organization can quantify this loss of end-user productivity in financial terms, and I’d bet that it’s not what they expected when they introduced IT self-service capabilities to make operations and outcomes “better, faster, and cheaper.” It’s a key reason why the adoption of self-service portals, and the associated return on investment (ROI), are lower than expected.
This data, along with the first shared chart, makes self-service a prime candidate for continual improvement focus.
Using experience Factors to drive continual improvement
As with problem management, continual improvement efforts need more than identifying an issue to succeed. Instead, more detail and, ideally, the root causes are required. This detail is where the Factors mentioned above come into play.
The aggregated Global IT Experience Benchmark Report H2/2022 data shows the top three contributing Factors for employee Happiness (a score of 9-10) with IT to be:
- Speed of service
- Service personnel’s attitude
- Service personnel's skills
Whereas unhappy employees (a score of 6 or lower) highlighted:
- The IT service desk didn’t solve their issue despite ticket closure
- Slowness of service
- Having to reexplain the issue and provide details repeatedly, i.e. being bounced between people
Finally, the key factors contributing to neutral feedback responses (a score of 7-8) were:
- Speed of service
- Having to reexplain the issue and provide details repeatedly
- It was difficult for the employee to know where to start
This Factors data opens up many avenues to consider for IT support improvement (if this is what matters most to your end-users).
There are many more common opportunities for continual improvement within the Global IT Experience Benchmark Report H2/2022 data. Still, your organization ultimately needs to understand its own performance, in experience terms, and what matters most to its employees.
If you'd like to learn more about using experience data to drive continual improvement, please check out this on-demand webinar from industry authority Roy Atkinson: Creating the Business Case for EX-driven Improvement.
You may also find our previous content on the topic of Continual Improvement useful:
Related content
03.08.2021
Why Continual Improvement Needs Employee Experience Data
Are your IT service desk’s continual improvement efforts missing an important something? Perhaps it has a good number ...
Read more >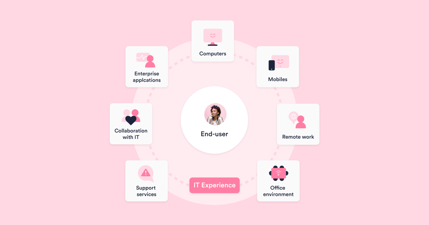
01.03.2023
Keeping the End-User in End-User Experience
The term experience is everywhere we turn. Sometimes its frequent, buzz-word usage borders on the comical: I remember ...
Read more >