

How to use Real-time Experience Data in ServiceNow to understand where End-users struggle the most
No more being swayed by the “loudest voices” and making decisions with “gut feelings"!
Use real-time experience data in ServiceNow to focus on improving the IT areas that are affecting end-user happiness and productivity the most, and achieving better business outcomes.

There has long been a disconnect between the corporate IT department’s view of their service and support capabilities and that of their end users – the organization’s employees. This predates the corporate “IT revolution” that was fueled by “the consumerization of IT,” predates the growing expectations of employees (that’s tied in with both consumerization and employee experience factors), and predates the changing needs of remote-working employees that are a result of the global pandemic (plus, the “work from anywhere” strategies that have followed).
Unfortunately, this disconnect has been, and continues to be, hidden-from-sight for many IT departments – with IT service providers unable to see where and how end users, or employees, struggle most. To help, this blog explains how real-time experience data in ServiceNow can be used to understand where end users struggle most – to improve the employee experience and to deliver better business operations and outcomes as a result.
Understanding the IT-employee disconnect
Unfortunately, much of this IT-employee disconnect is thanks to IT’s ongoing reliance on traditional performance metrics that fail to measure the right things and at the right points. For example, IT metrics are commonly focused on IT outputs not business-related outcomes. Plus, many are focused on operations – the “mechanics” of IT service delivery and support – and they’re measured at the point of IT supply rather than at the point of end-user consumption.
As a result, while IT departments see a “sea of green” in their performance measurement scorecards the employee perceptions of the services they receive might be far from great. It’s what the IT industry has termed “watermelon service level agreements (SLAs)” which while green on the outside and red on the inside (once cut open).
The historical service-provider and service-receiver disconnect
The Forrester Research chart shared below is old – in fact, very old in corporate IT terms given how much has changed in the last decade – but it does show the historical disconnect, or gap, between IT-supplier and IT-consumer perceptions very well. That, even in 2012, IT’s perceptions of their capabilities – likely fueled by their performance metrics – consistently exceeded those of their end users. Whether this is the quality of IT support, where IT scores itself highly, or the investment in emerging technologies at the other end of the spectrum.
To what extent do the following statements describe your firm’s IT organization’s processes and capabilities?
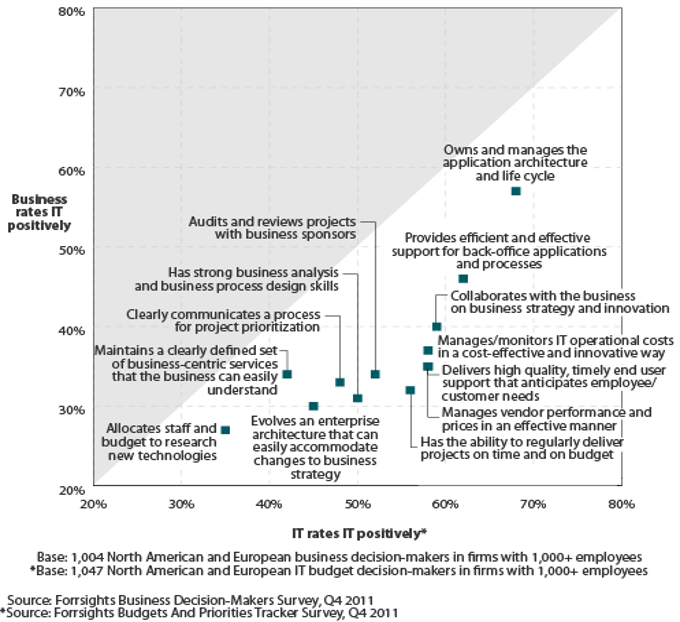
Importantly, for your organization, do you know if this gap is still there? Or whether the gap is more prevalent in some IT capabilities/services than others? Or whether the gap has widened because employee expectations of corporate devices, apps, and services have risen significantly over the last half-decade in particular?
“Mind the gap”
What does your current portfolio of IT metrics tell you about your capabilities and performance? That everything is great (because there’s that “sea of green”)? That there are no significant employee issues and there’s consequently no expectations or experience gap?
More importantly though, has this blog planted a seed of doubt in your mind that the hard work of your IT personnel, the use of best practice processes, and ServiceNow’s powerful service automation capabilities might still be leaving employees struggling with some service and support areas?
If so, please keep reading to find out how employee experience data will help.
The need to focus on the right things (from an employee perspective)
If you want to deliver the service and support that your employees – or customers – both expect and demand, then there’s a need to better understand how well your IT department is performing in meeting their needs. This is the experience-based “signal” that can then be used to drive the actions needed for improvement.
The above Forrester chart covered a lot of ground – from “owning and managing the application architecture and lifecycle” to “delivering high quality, timely end user support that anticipates employee/customer needs.” But it poses another important question (in addition to “How well is your organization doing?”) – related to which of these many areas are most important to your employees? Especially now that much of the business world has finally woken up to the fact that the quality of IT service and support has a big impact on employee experience, particularly in terms of an employee’s ability to do the work they need to do (when they need to do it).
Using your end-users as key IT-performance “sensors”
Your end users are the best “sensors” when it comes to what’s working well for them and what’s not, rather than the many traditional IT metrics that are likely concerned with the operational perspectives of “how fast” and “how many.” Your end users can provide the real-time experience data that offers both summary and granular insights into IT’s performance from an employee perspective. In particular, highlighting the areas where they, as employees, are struggling the most.
While traditional IT metrics such as “percentage availability” have value, they aren’t always a great view of the employee experience and can provide a misguided view of IT performance. For example, where a service is available but not realistically usable by the end user. Or when the small level of non-availability happens when the availability is needed most, such as during period-end routines for finance teams. In both of these scenarios, while traditional availability performance measures won’t highlight the issues, the employees who are adversely impacted by the issues could.
It’s why more and more organizations are employing experience-based metrics (and outcome-based experience level agreements (XLAs)) in addition to their traditional portfolio of performance measures (and SLAs). For example, the measurement of employee happiness and employee lost productivity, based not only on the fact that the lost productivity is important to employees – and their ability to get their work done – but also the realization that improvements in employee happiness bring about productivity improvements too.
Here, the most effective way to gauge employee happiness and productivity is to ask them, making your end users key IT-performance sensors of IT’s service and support capabilities.
Tuning in to the signal
At HappySignals we like to ask, “When was the last time you heard the statement ‘Thanks to IT, I was able to…’”? Our customers hear it – because 78% of the feedback their IT departments receive is positive. But there are still issues to address and, using real-time experience data, they’re able to focus on what end users say they want (and need) to give them frictionless IT. This not only ups employee happiness but also leads to increased productivity because less time is wasted on ineffective IT issue resolution and service provisioning.
Understanding the level of lost, or wasted, time is important. Think about some of the common IT issues. Does a daily five-minute boot-up time matter in employee productivity terms? What about one hour of wasted working time per month? The only way to know is to get employee feedback because the former, while twice as long in aggregate, might have minimal employee impact.
Extending this example, access to real-time experience data in ServiceNow might highlight that end users in Sweden lose most time, and productivity, because of CRM system issues when working from home. Scarily, in this example, this one hour isn’t likely just one hour of lost productivity – it might be one hour lost for each of the 15,000 employees who use the CRM system while working remotely.
Such a technical or service-based issue might be a significant cause of employee unhappiness and a drain on corporate resources; and through the use of real-time experience data, to address the issues that employees struggle with, our customers have on average made a 26% improvement in productivity by focusing on what’s really important to end users.
Acting on the signal to improve operations, experiences, and outcomes
As shown in the diagram below, acting on the signal to improve the employee or end-user experience is a cycle constituted of measurement, sharing, identification, and then improvement.
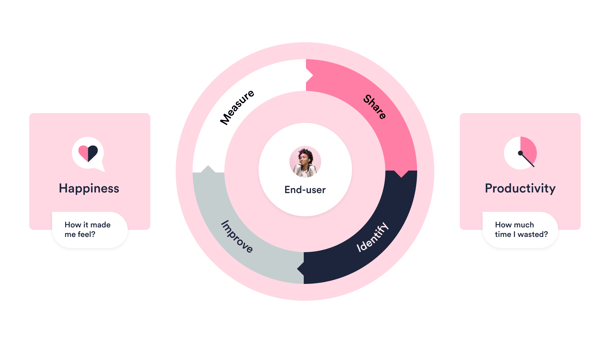
The HappySignals platform not only captures the important end-user feedback on IT performance, it also allows you to share the measurement data – the experience data – in real-time to key business stakeholders. This is not just within IT and the wider business. This can also include partners and vendors too when appropriate to do so. This helps your organization to create the transparency and trust that allows it to move to the next step by setting up XLAs and outcome-based metrics in ServiceNow that lead to improvement.
Using a non-IT analogy might help to explain this. For example, in healthcare, if hospital staff are focusing on outputs rather than outcomes, then they’ll measure how many patients leave the hospital each day. Whereas a more appropriate measure would be how many patients are cured each day, i.e. an outcome not an output. Ultimately, if you measure the wrong things, then you’ll likely get better at the wrong things.
Moving to data-driven improvements
Real-time experience data will allow your organization to focus on what matters most to end-users and their productivity (and to business operations and outcomes as a consequence). Allowing your organization to move on from responding to the discontent of the “loudest voices” and needing to use “gut feelings.” To instead focus on the data-driven improvements related to what end users struggle with most.
Want to find out more about how to use real-time experience data in ServiceNow to understand where and how your end-users struggle most?
Watch our in-depth Webinar “How to prove value of Now Platform and IT Services through Experience Management”!
Related content
31.03.2020
How 5,500 End-Users Feel About Remote Work, Latest Survey Results
Due to recent events, remote working has become the forefront challenge organisations are having to face. For many, ...
Read more >
13.03.2024
Ticket bouncing, frustrated end-users – what can IT do?
Have you ever called a customer service department only to be passed from one customer service agent to another while ...
Read more >