

How to Get a Better Understanding of All End-User IT Touchpoints in ServiceNow
Getting accurate insight into how well, or not, each of your end-user IT touchpoints is performing can take time and effort. Especially gathering end-user feedback based on what’s most important to them, not what’s most important to IT. This blog explains how your organization can get better understanding of all end-user IT touchpoints in ServiceNow.

Modern IT service delivery and support capabilities – offered by solutions such as ServiceNow – have widened the spectrum of end-user, or employee, touchpoints that your IT department needs to monitor for effectiveness and improvement opportunities.
This is in addition to the various devices, applications, and services that employees are reliant upon to go about their work, including those introduced to enable pandemic-related remote working, and includes the various support channels – new and old – that are offered as part of an omnichannel experience.
But how well are your end-user IT touchpoints working?
If your current customer satisfaction (CSAT) results are to be believed, then it might look as though everything is working well – with the rolling CSAT score exceeding the agreed-on service level agreement (SLA) target. However, as is often the case, the devil is in the detail.
For example, the high use of the traditional telephone channel might mask the under-adoption and underperformance of other channels. Perhaps with a vicious circle – for instance, where a poor self-service experience pushes an employee back to the telephone channel – meaning that adoption levels stay low, the expected benefits of the new channels aren’t realized, and the issues related to the new channels aren’t visible to those monitoring the end-user IT touchpoints.
To help, this blog explains how your organization can get a better understanding of all end-user IT touchpoints in ServiceNow.
The many issues of traditional CSAT surveys
If you’re still thinking that your CSAT scores tell you everything that you need to know about your IT touchpoints, then this section – on the issues of traditional CSAT surveys – will help you to understand why a different perspective is needed.
While CSAT surveys have traditionally provided some balance to the many operationally-focused performance metrics employed in IT, they can fail to deliver much-needed insight. Perhaps identifying some of the issues caused by process bugs, ineffective changes, or service delivery failures, say, but definitely not catching them all.
This lack of insight is caused by a variety of factors, which include:
- Low response rates – perhaps due to survey complexity or the potential surveys takers not being convinced that their responses will be read let alone acted upon
- Feedback skewing – with scores potentially biased through only those who received exceptionally great or poor service taking the time to respond
- Being operationally focused – often taking an IT rather than an employee view of the service or support that was delivered, measuring the operational “mechanics” rather than what’s most important from the recipient’s perspective
- Limited context of the interaction – with no extra detail on why the respondent was happy or unhappy with their engagement with IT
- Delays in feedback receipt – either a lag between the interaction in question and the sending of the CSAT questionnaire or the response (or even both)
- Taking singular snapshots of performance – rather than providing a constant stream of feedback such that issues can be tackled “in the moment” when appropriate
- Treating all metrics as equal – not just failing to recognize what’s most important to end users but also not understanding the difference between lagging and leading indicators.
These and other issues should be kept in mind when looking at how your IT touchpoints are currently working, as should the possibility of issues being lost in the aggregation of data.
A view of all IT touchpoints is different from the view of all IT touchpoints
Sounds confusing? This is what I mentioned in the example in this blog’s introduction – where the aggregation and viewing of feedback as a singular data point hide the issues within specific IT service and support channels (or touchpoints). That a high-volume and high-scoring channel such as telephone might drown out the issues that are hidden in the smaller volumes of chat channel feedback, say.
To the service provider, all the offered service and support capabilities look great – because service-level targets are consistently being met – but to the end-user, the chat channel is far inferior to the telephone channel. The result is that the chat channel is avoided, and the telephone channel used – negating the investment in, and benefits of, the chat channel for IT support.
Of course, the impact might be far more significant than the impact on end-user preferences of IT touchpoints. The poor chat experience might cause the end-user to seek help elsewhere in the future or to struggle on with an issue. Both of which adversely affect their productivity and business operations and outcomes as a consequence. It’s likely to affect the perceptions of the IT organization too.
Hence, the best way to view all IT touchpoints in ServiceNow is to view the individual channels in isolation – to better understand what’s working well and what isn’t. Importantly, for end-users, not IT.
Although, knowing the relative level of channel adoption and having the ability to drive demand to certain channels is a significant benefit for IT service desks. Whether this is to better cope with demand via the increased use of self-service, to speed up resolutions, to reduce the cost of support, to improve the employee experience, or for another reason.
How to get a channel-based view of your end-user IT touchpoints in ServiceNow
You might think that your CSAT feedback already allows you to accurately do this – although if you’re that certain of this, especially given the common issues listed above, then you probably wouldn’t be reading this blog.
To truly get accurate insight into how well, or not, each of your end-user IT touchpoints is performing, there’s a need to gather end-user feedback based on what’s most important to them and not what’s most important to IT (which is often what traditional IT metrics focus on).
Based on the years that we’ve been working with our customers to improve the performance of their IT support capabilities (in line with end-user expectations and needs), the chart below shows both what’s most important to end-users and the relative level of performance of each of the most common IT touchpoints at an aggregated level, i.e. across all of our customers.
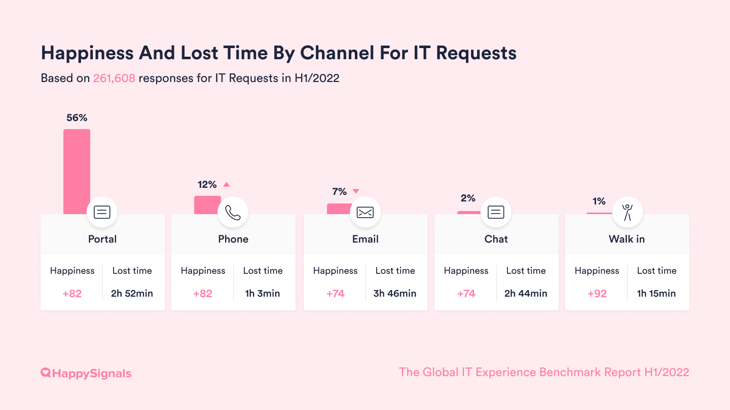
Comparing the performance of different end-user IT touchpoints in ServiceNow
The above chart shows three key data points relative to the five most common IT support channels for incident handling:
- The relative proportion of channel use (based on feedback). For example, Chat channel use is still relatively low. Or that self-service Portal use has increased significantly over the last few years (at the expense of the Email channel), or at least it has for HappySignals customers who have been able to improve the self-service experience.
- The level of end-user happiness for each channel. This shows that the Portals and Phone channels are the best IT touchpoints for end-users.
- The level of employee lost productivity for each channel. Surprisingly, the self-service Portal is still losing end users the most productivity – nearly three times the loss with the Phone channel – despite the promise of the immediacy of resolution or provisioning.
Hopefully, these experience based insights are interesting. But, more importantly, have they made you question your knowledge of your organization’s end-user IT touchpoints and their relative performance levels (in employee, not IT, terms)?
Want to find out more about how experience data can help your organization to understand – and improve – its end-user IT touchpoints in ServiceNow?
Watch this 3-min demo on using HappySignals to measure end-user experiences, share experience data, identify focus areas, and make data-driven improvements.
Related content

13.03.2024
Ticket bouncing, frustrated end-users – what can IT do?
Have you ever called a customer service department only to be passed from one customer service agent to another while ...
Read more >
30.06.2021
How to use Real-time Experience Data in ServiceNow to understand where End-users struggle the most
There has long been a disconnect between the corporate IT department’s view of their service and support capabilities ...
Read more >