
What it measures
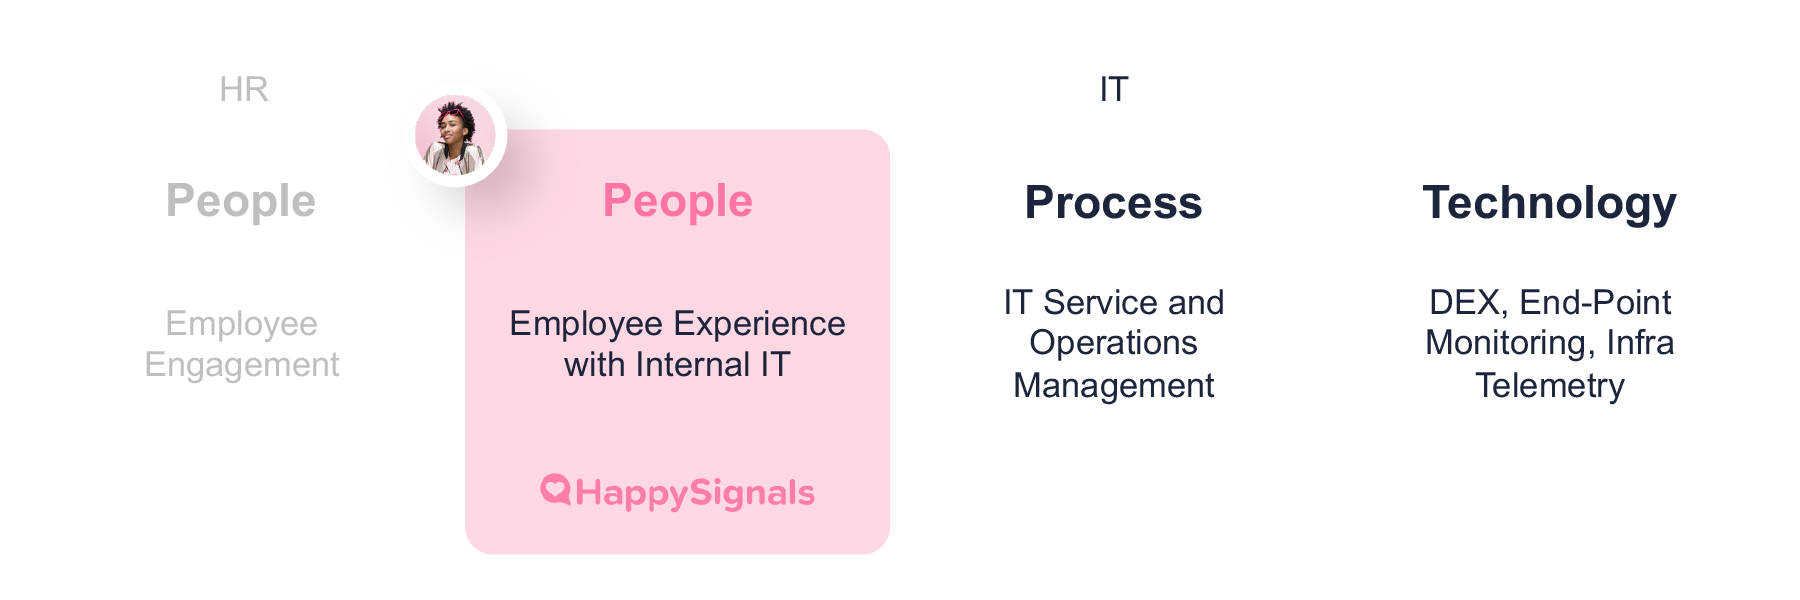
HappySignals measures two things that traditional IT metrics miss entirely.
Happiness
Every time an IT interaction is resolved — an incident closed, a request fulfilled — HappySignals sends a short, research-backed survey asking the employee how the experience felt. Not a long-winded questionnaire. Not a biased five-star rating. A simple, science-backed pulse that captures genuine sentiment at the moment it matters most.
Lost time
Alongside sentiment, HappySignals asks employees how much time they lost because of the IT issue. This is perception-based — and that's exactly the point. Perceived lost time reflects the real-world impact of IT friction on an employee's ability to do their job. It's the metric that connects experience to business productivity in a way that SLAs and resolution times never can.
.png)