
Use case: Reassignments

.svg)

Leading IT teams drive their ITSM with experience data


Don't just take our word for it
Here is what our customers are saying.

ITSM operations people love
Learn how HappySignals helps ITSM teams uncover where frustration builds up, why it happens, and how to fix what truly matters —creating happier, more productive end-users.

FAQ: Reassignment counts (ticket bouncing) in ITSM — and how HappySignals helps
How HappySignals helps: HappySignals connects reassignment counts directly to experience outcomes (happiness + lost time) so you don’t just track “bouncing” — you see what it’s doing to employees, by service, channel, team, and vendor.
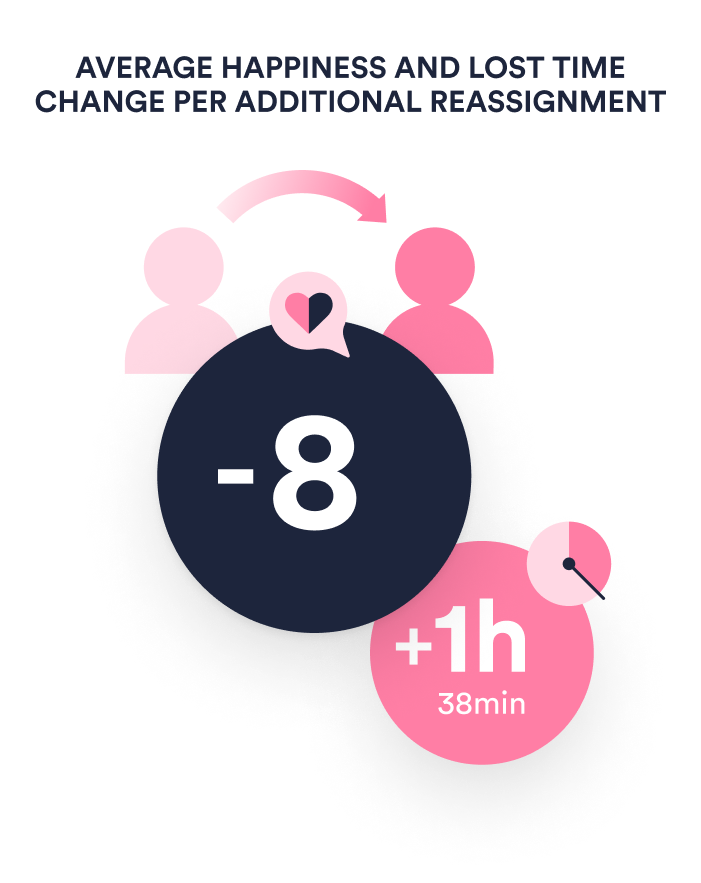
Because each handoff creates waiting, context rework, and delays. In practice, every reassignment can add significant time loss and drag MTTR down.
How HappySignals helps: HappySignals quantifies productivity impact with Lost Time and correlates it with reassignment counts, so you can prioritize the fixes that recover the most employee time — not just the ones that improve a dashboard.
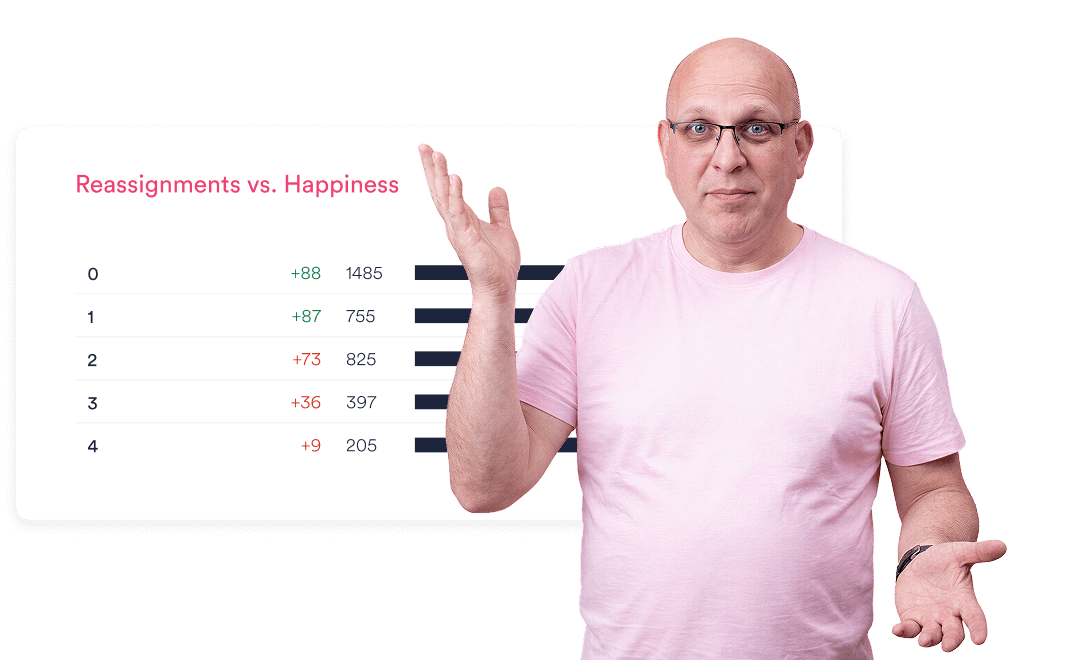
When reassignments go up, happiness tends to go down. More handoffs usually mean more uncertainty, more repetition, and a longer path to resolution.
How HappySignals helps: HappySignals turns that relationship into hard evidence by linking ticket-level feedback to operational drivers (including reassignments). You can prove which handoffs harm experience most — and where.
“Move the ticket right first time.” The practical goal is fewer handoffs and higher First Contact Resolution / first-touch resolution, especially in high-volume categories.
How HappySignals helps: HappySignals makes “right first time” measurable by showing which categories/services/channels cause the most reassignments and the biggest experience damage—so you can focus on the highest-impact routing and ownership improvements first.

Common drivers include poor categorization and routing, missing intake information, unclear ownership between teams/vendors, skill mismatches, and silo boundaries.
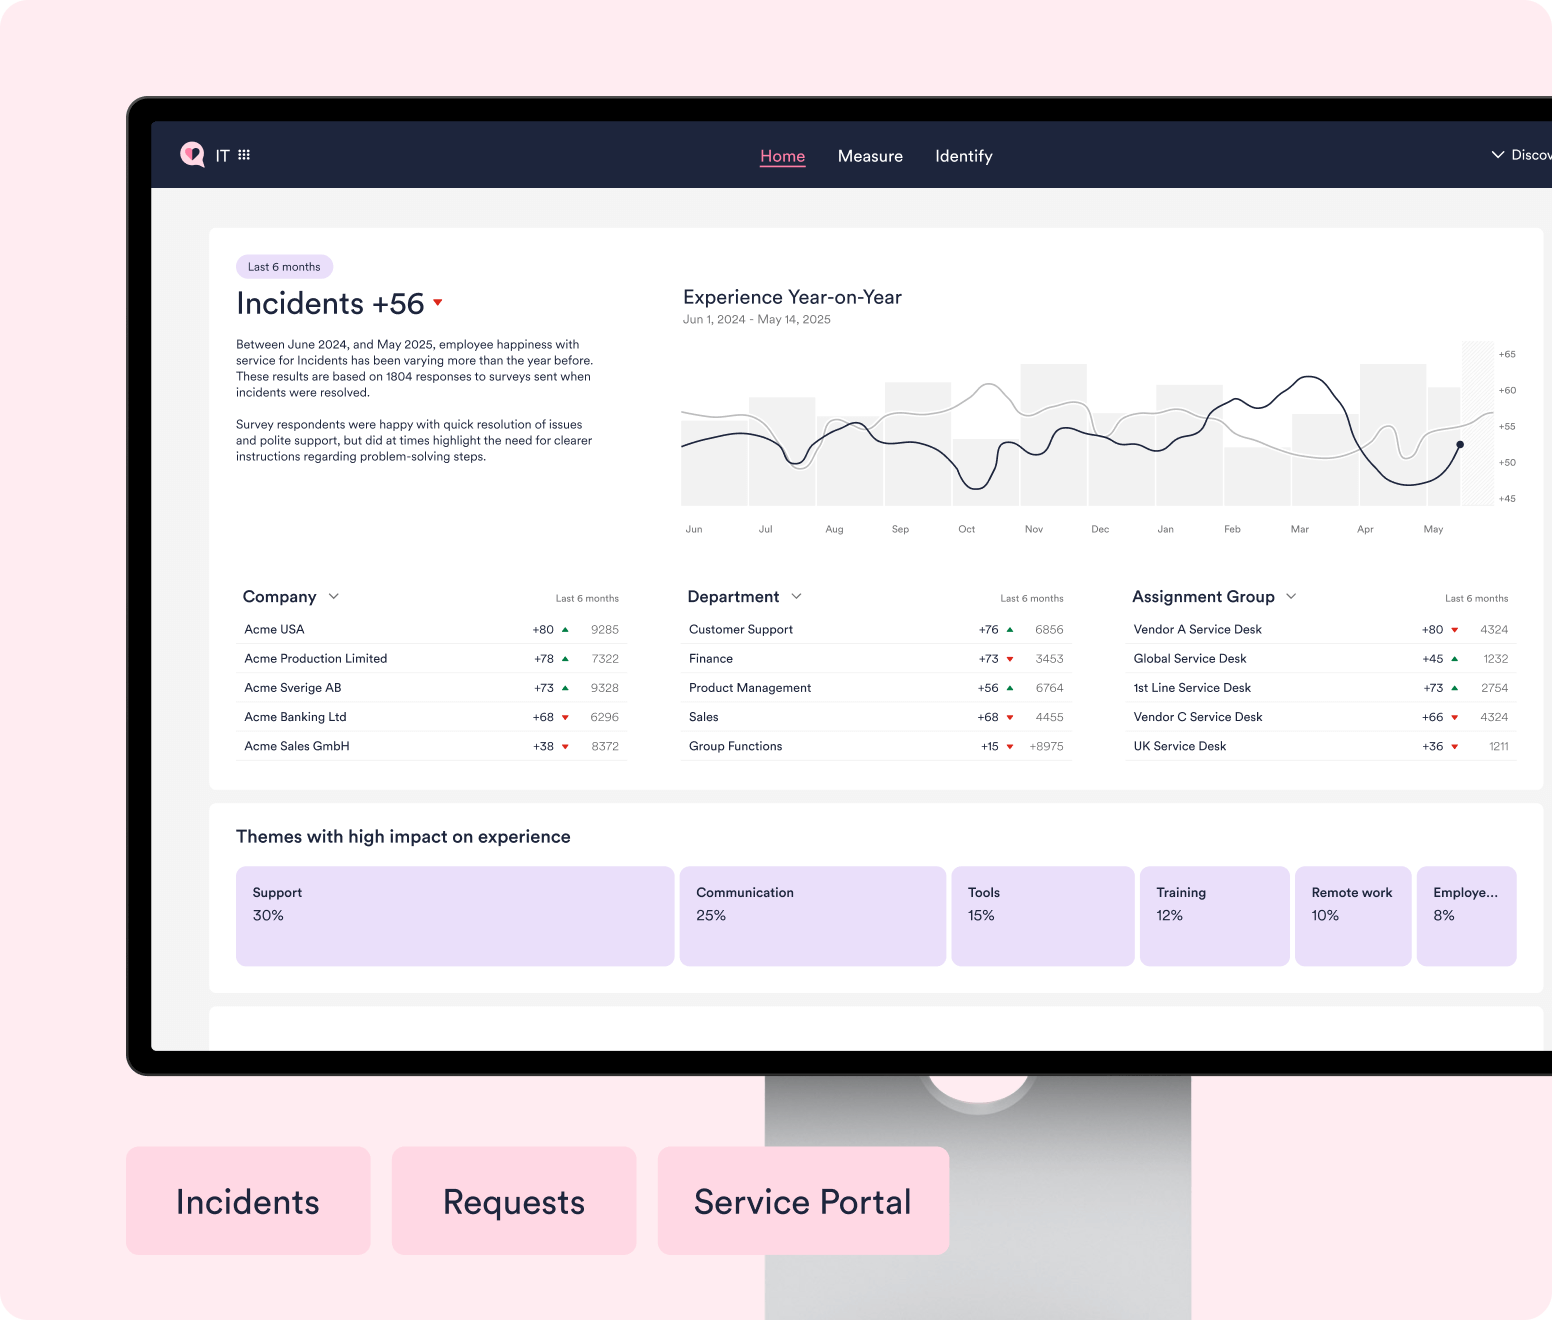
How HappySignals helps: HappySignals pinpoints the root patterns behind bouncing with drill-down segmentation (service, category, location, channel, team, vendor) and highlights the operational drivers that repeatedly create reassignments.
Filter for higher reassignment counts (e.g., 3+), then break down by service, category, channel, region/site, and vendor/team. Usually a few repeat patterns create most of the bouncing.
How HappySignals helps: HappySignals gives you “click-to-cause” analysis: start from a reassignment view and immediately see where it concentrates, how it impacts lost time and happiness, and which teams/vendors/services are responsible—without building custom reports.
Fix the biggest repeat patterns first: improve routing rules and categorization, clarify ownership between resolver groups/vendors, strengthen knowledge for frequent issues, and remove handoff-heavy workflow steps.
How HappySignals helps: HappySignals helps you choose the right fixes by showing which changes will improve experience most, then validates results continuously with high response-rate feedback tied back to ITSM data—so you can improve iteratively, not guess.
Metrics can look better without real improvement (e.g., changing assignment practices so reassignments don’t “count”). You need to validate outcomes, not just compliance.
How HappySignals helps: HappySignals makes gaming hard because it anchors performance to employee experience (happiness + lost time) and operational truth from your ITSM tool. If reassignment counts “improve” but experience doesn’t, you’ll see it immediately in trends and correlations.