Use case: Channel optimization

Support your IT support channels

Oversee employee frustration, allocate your resources effectively, and analyze what's working and what isn't. Achieve what you need to with HappySignals support channel optimization.

hero-channel-development

Compare and benchmark

Compare how different support channels perform at solving people's IT issues, and see how yours stack up against our benchmark.

Experience indicators

Find out the reasons why people are unhappy with the underperforming ones: is the queue too long, or is the personnel attitude not right?

Decisions based on people

Make decisions on which channels to optimize and invest in, and track your progress easily.

How does HappySignals help you identify the best support channels?

channel-employee-data (1)

Fulfill different people's needs

  • Your sales people need to be able to get support on their phone while they're driving from one location to another for meetings.
  • Meanwhile, tech savvy office workers are happy to use the self-service portal and chatbots.

Get data on how everyday activities, roles and responsibilities affect how your employees interact with IT and what channels suit them.

Features

reduce-costs

Reduce costs or improve experience?
Why not both?

In IT, the assumption is that you can't both reduce costs and improve experience.

Two simple metrics – happiness and lost time – show you in real time how employees experience support channels. 

You can support the channels that work for people, and deprioritize the ones that don't. With continuous data, see the impact of your actions and track the progress.

Features

itsm-benchmark-channels

Compare against The Global IT Experience benchmark

Having experience data for your channels is great — but what if you could actually prove your channel mix is world-class?

An automatically updated benchmark gives you that perspective. It shows where your channels truly deliver the best experience and minimize lost time — using an unbiased, reliable comparison.


Features

mark-says-channels

"People have that a-ha moment when they see that, e.g., their channel effectiveness scores at 80% for phone use vs 10% everywhere else."

- Mark Bewick, Senior ITXM Advisor

Leading IT teams drive their ITSM with experience data

HappySignals-for-ITSM-CTA

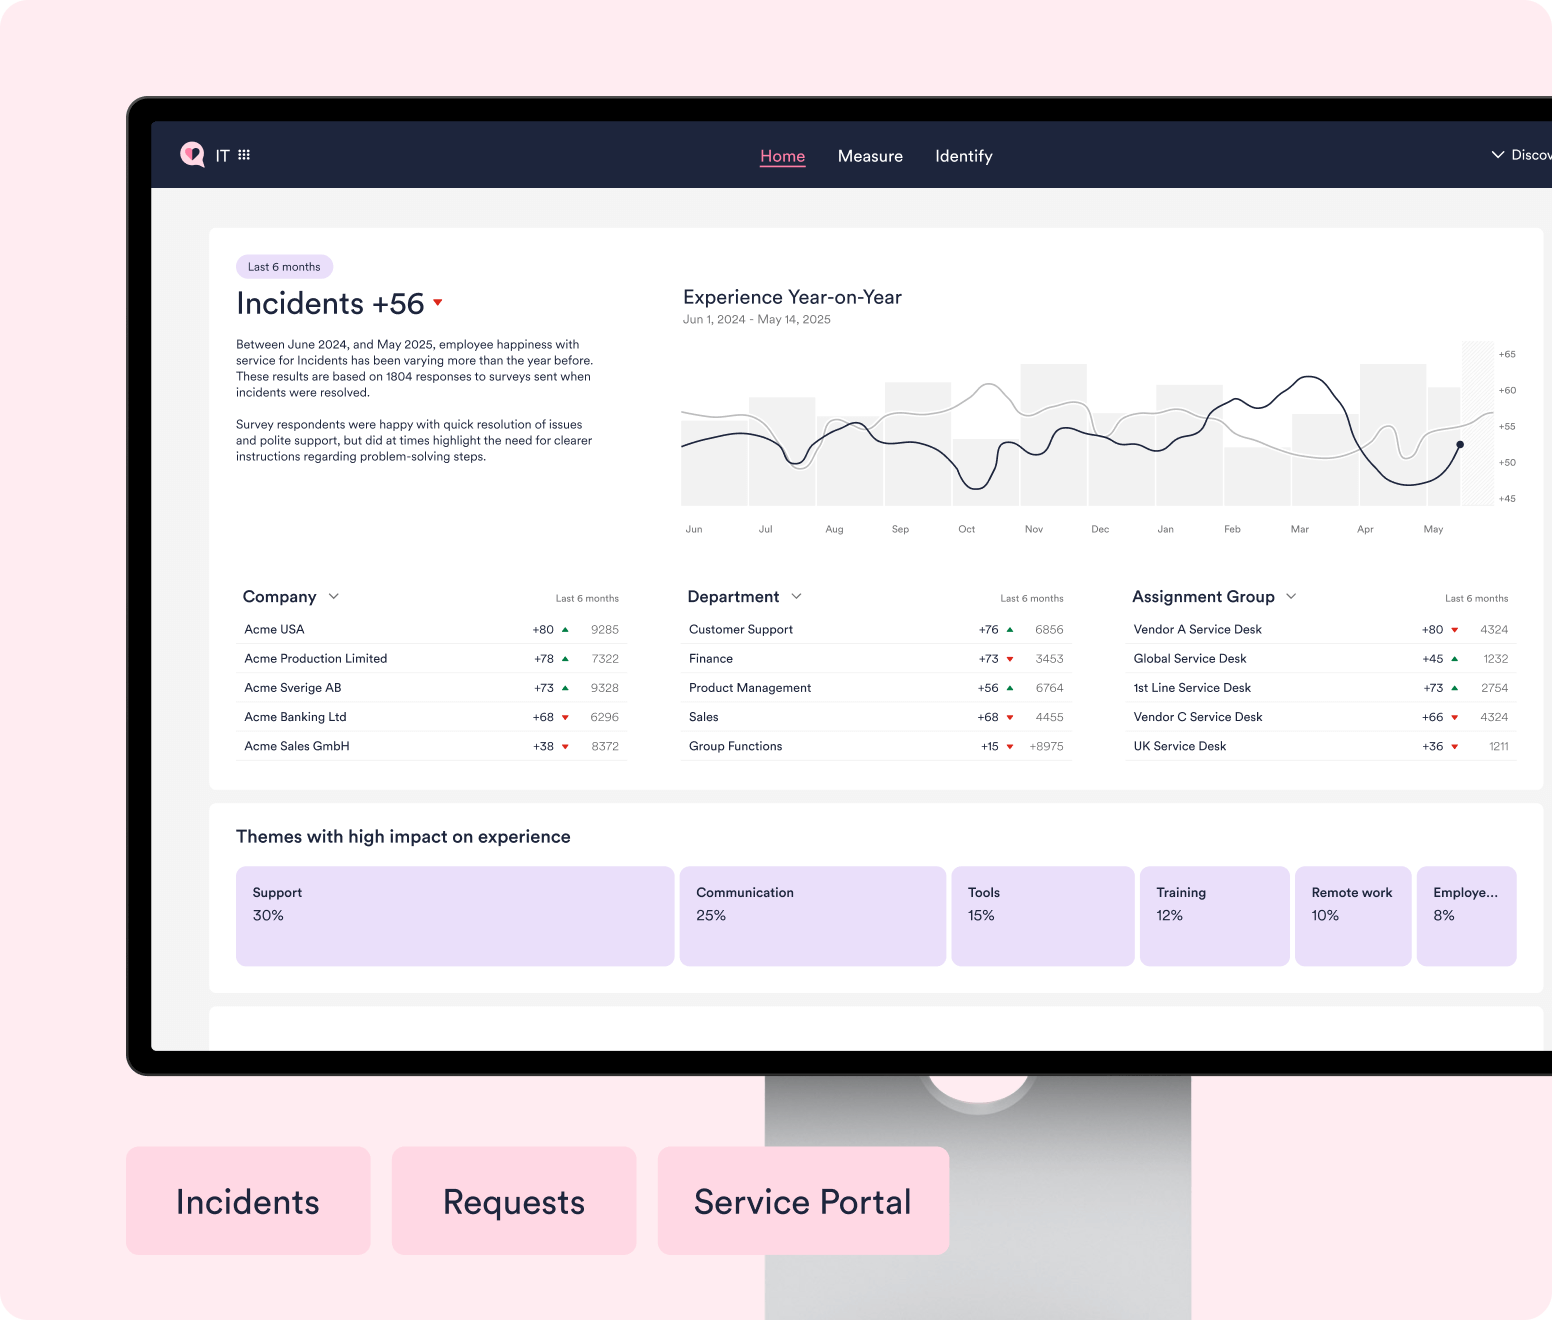
ITSM operations people love

Learn how HappySignals helps ITSM teams uncover where frustration builds up, why it happens, and how to fix what truly matters —creating happier, more productive end-users.


In case you're wondering

You can measure your own set of channels: service portal, email, phone. walk-up etc. depending of what your ITSM consists of.

When an employee interacts with IT (e.g. after a ticket is resolved or through proactive surveys), they can fill out a survey that is focused on how happy they are with IT, how much time they lost and what influenced their experience. This allows HappySignals to capture insights specific to each channel, helping you understand how the experience differs across email, portal, chatbot, walk-ins, etc.

The results are shown in the HappySignals platform where you can filter and compare data by channel in the analytics dashboard — making it easier to spot patterns and improve the channels that matter most to your employees.

You can discover how the surveys work here.

You can start seeing reliable channel insights once you have about 30 responses per channel. At that point, the key patterns (happiness, productivity loss, experience indicators) are usually stable enough for directional decisions. Usually, this takes only a few days for an enterprise organization.

We support the major ITSM platforms. You can find the full list on our integrations page.