What is HappySignals?

The Experience Intelligence platform for IT

HappySignals explains how people are impacted by the technology they use at work.

Why do we exist

Our CEO, Sami Kallio, explains it...

Our mission

We exist because a working day should hold more smiles and less wasted time — for everyone, in every job that depends on technology.

Our vision

A future where, as IT increasingly runs itself, people remain the measure of success.

Origin story

Before HappySignals existed, our founders interviewed ten IT leaders and asked a simple question: what do you know about how your employees experience IT?  

Almost every answer was the same: "Our CSAT is 3.7." And when asked whether 3.7 was good or bad, nobody knew. It had just always been 3.7. One number. No context. No direction. 

That conversation revealed the real problem. One average number kills development. It hides the teams who are struggling, the locations losing hours every week, and the people who have quietly given up on IT. A score that had stopped challenging anyone to do better. 

Experience Intelligence exists to break that average open. 

We built something different: continuous feedback employees actually respond to, segmented so no group stays invisible, and benchmarked so you always know where you stand.  

Today, more than 15 million responses later, no HappySignals customer ever has to ask whether their number is good or bad. They know. 

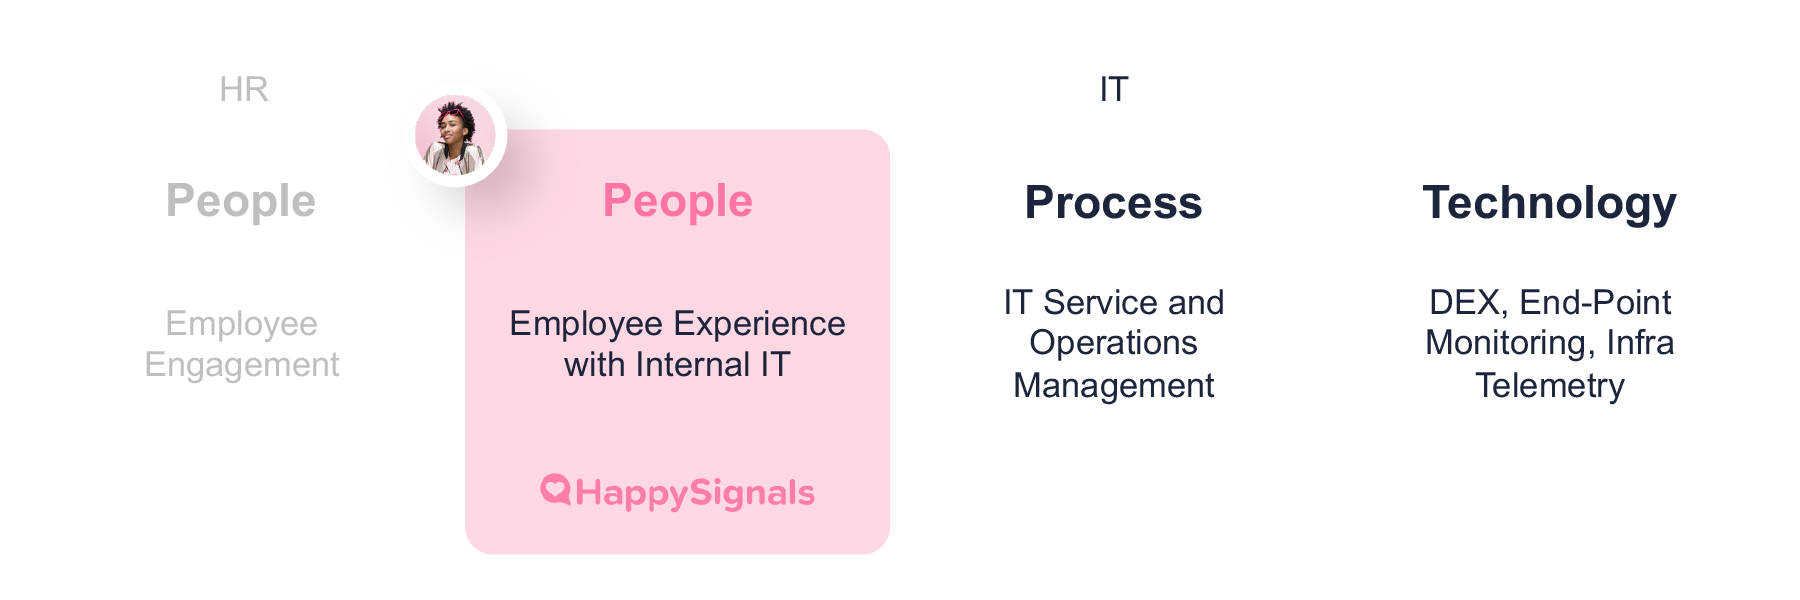
People. Process. Technology. In that order.

Experience is always happening. Measured or not, people are having an experience with IT right now. Every interaction, every frustration, every moment where technology helps or slows someone down. Are you listening?

Technology doesn't create value on its own. People do. Start with their experience, design the process around it, and let technology support what actually works.
people-process-tech
This is human-centric IT. And it's the philosophy behind everything HappySignals does.

When technology slows people down, they feel it immediately. A system can be technically "within spec" and still cost an employee an hour of lost productivity. That's why humans are the best sensors you have. Emotions are complicated, but they're also your most valuable signal.  The best IT teams don't avoid that. They harness it.

IT metrics say everything is fine. Employees know differently.

Most IT organizations measure what's easy to measure, such as ticket volumes, resolution times, SLA compliance, device health, uptime, and AI tool and app usage. By those numbers, everything could look green.

But green dashboards don't tell you that 13% of your tickets are causing 80% of your employees' lost productivity. And they don't tell you which services are quietly eroding trust and engagement while every metric stays in spec.

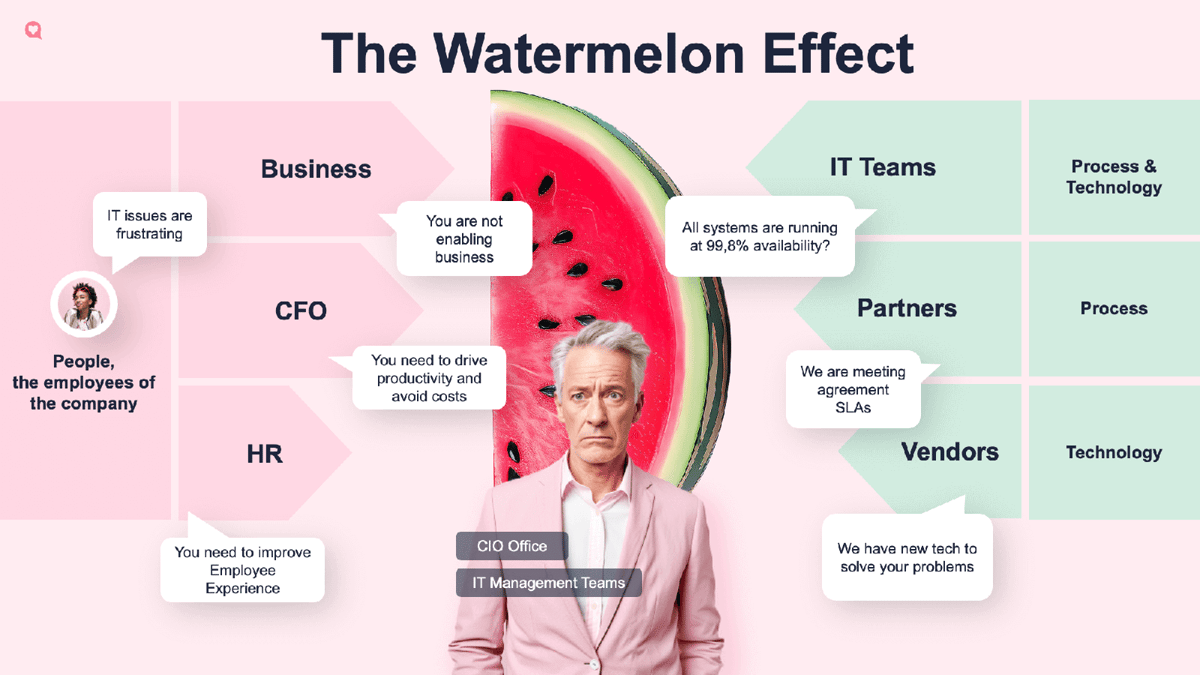
This is the watermelon effect. Green on the outside, red on the inside.

What is the watermelon effect? See this picture

The cost is real, and it's hiding in plain sight. The average IT incident costs an employee about 3 hours and 18 minutes of lost productivity, roughly €126 at typical European labor costs. For a 5,000-employee organization, that's €7.6M a year that never shows up in a ticket count.

Two questions every IT team should be able to answer

Who are your employees?

Not as a headcount. As people, with different roles, workflows, locations, IT skills, attitudes towards AI, and different needs.

How is each group experiencing IT, right now?

Not how IT is performing overall, but beyond the average,  broken down by group, with evidence.

How much is lost productivity costing the business?

Not the visible number: tickets closed, usage data, devices deployed. The invisible one: the hours people lose, and what that costs.

How it works

"Experience is the signal. Intelligence is what makes it useful."

HappySignals is the Experience Intelligence platform for enterprise organizations, built on a decade of our own experience data and continuously refined by IT Experience Management experts. It integrates with the ITSM and DEX tools already in your stack, including ServiceNow, BMC, and Nexthink.


Experience Intelligence starts with the signal traditional IT tools miss — the human experience. Then it makes that signal useful by connecting it to everything you already know.

What it measures

What it measures

HappySignals measures two things that traditional IT metrics miss entirely.


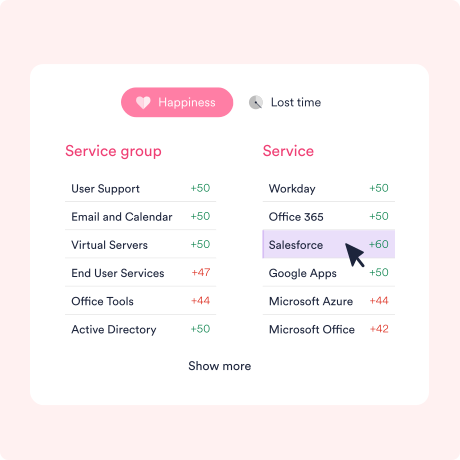
Happiness

Every time an IT interaction is resolved — an incident closed, a request fulfilled — HappySignals sends a short, research-backed survey asking the employee how the experience felt. Not a long-winded questionnaire. Not a biased five-star rating. A simple, science-backed pulse that captures genuine sentiment at the moment it matters most.
 
Lost time
Alongside sentiment, HappySignals asks employees how much time they lost because of the IT issue. This is perception-based — and that's exactly the point. Perceived lost time reflects the real-world impact of IT friction on an employee's ability to do their job. It's the metric that connects experience to business productivity in a way that SLAs and resolution times never can.


What it correlates

A feeling on its own is just a feeling. Intelligence comes from context. Experience Intelligence brings four kinds of data together.

Knowing who your employees are — not as a headcount, but as people — is what turns a number into a decision. And by having all of these types of data, IT leaders have a complete picture: not just how people feel, but what that feeling is costing the business.

Operational data

Things like country, business unit, service, channel, vendor, that you can share through your ITSM or Microsoft Entra, and serve as a base for the data you get from our surveys.

Technical data

Device, application, network, and telemetry signals from your ITSM and DEX tools.

Experience data

The data we get from our surveys. It shows how employees feel about their experience with different IT touchpoints and how much time they lose.

Employee data

An additional layer of data that brings you context and insight about employees' work routines and habits: their roles, work routines, technology mindset, how they feel about AI, etc.

How the intelligence reaches you

What makes HappySignals different?

The whole story behind the experience

Go beyond a satisfaction score. HappySignals combines experience and operational data so you can see not just how people felt, but exactly why — and where to focus next.

Your AI-powered experience advisor

Stop spending hours digging through data. Just ask. Our conversational AI draws on over a decade of experience data from millions of responses, surfacing themes, generating reports, and answering your toughest questions in seconds. It’s like having a team of IT experience advisors at your fingertips.

Ready to deploy

HappySignals is designed to go live in weeks, not months — with certified integrations, research-backed surveys, and a proven onboarding methodology. No long implementation project. No custom survey design. Intelligence from day one.


  • Certified ITSM applications

  • Minimal setup and low admin overhead

  • ISO 27001:2022 certified, GDPR-aligned

  • Secured Microsoft Azure cloud with global data center options

  • Customer-owned experience data

Experience by user segments

Move beyond single average scores. HappySignals breaks down experience by role, work, responsibilities and skills — revealing hidden pockets of poor experience that averages miss, and helping you target improvements where they matter most.

Validated surveys and global benchmarks

Research-backed, standardized surveys that accelerate time-to-value from day one. Global benchmarks show you what good looks like — making your results comparable over time and across organizations.

The impact speaks for itself

On average, HappySignals customers recover 26% of lost productivity in their first year. Across a typical organization of 13,500 employees, that means reclaiming up to 2 million hours annually. Hours that go back to the work that actually drives the business forward.
 
And the signal behind it is real: 1.77 million responses across 130+ countries in the latest Global IT Experience Benchmark.
 

logo-ahlstrom


+150% increase in happiness. 57% reduction in lost time.


“HappySignals provides proper business intelligence for IT."

— Dr. Ozan Acar, Head of CIO Office, Ahlstrom


Read the full story →


campari-group-uses-happysignals-logo


500% increase in end-user happiness.


“A CIO working without experience data would be like a sales manager working without CRM."

— Christopher Woods, CIO, Campari Group


Read the full story →


Where to start: three experience areas

Experience Intelligence spans several areas, but start with one, get successful, then
carry the practices to the others. 

  • Service Delivery (ITSM) - go beyond CSAT to see which services, channels, and reassignments cost the most time.
  • Digital Workplace - pair with your DEX tool to add the human perspective on devices and apps, and find the friction that averages hide.
  • AI Transformation - measure the value of your AI transformation rollouts: who is getting value, who needs support, and where rollout is stalling on people, not technology.