
Your SLAs show green, your end-users disagree
You own a service like the laptop refresh program, the collaboration platform, the VPN, whatever it is. By every measure, your contract defines, it's healthy. However, you've sat in enough town halls and skip-levels to know that "the SLA is green" and "people are happy with this service" aren't the same thing, at all. Somewhere between the ticket closing and the employee actually getting back to work, something is getting lost, and none of your current metrics are built to catch it.

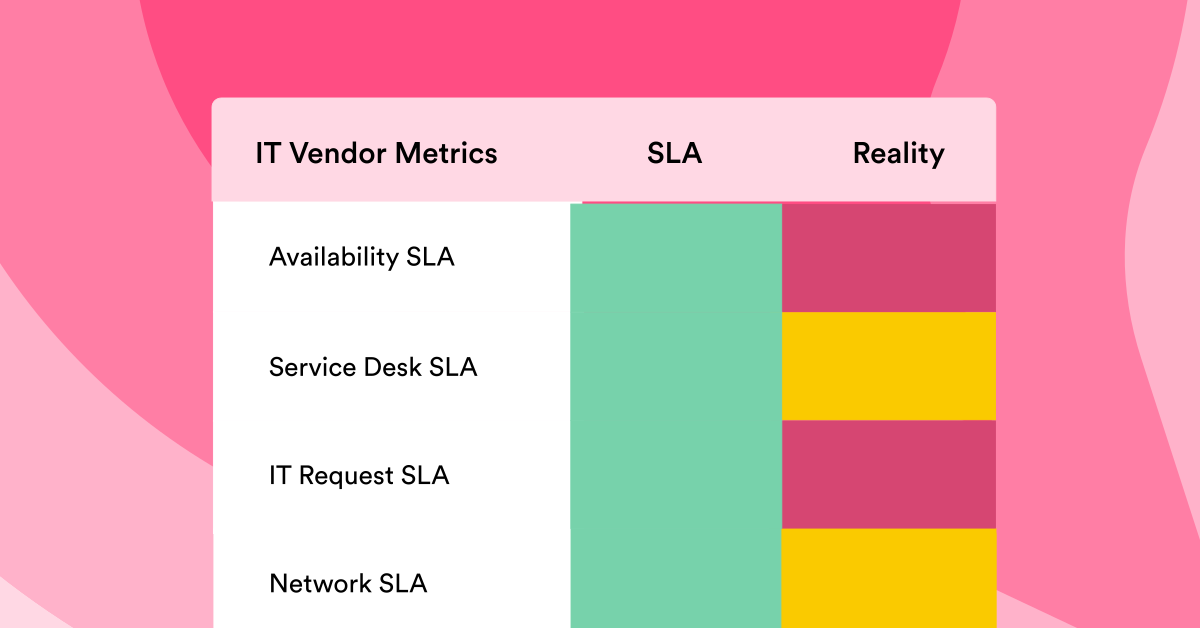
This is one of the most common blind spots in ITXM: the SLA can be entirely, contractually true, while the service is quietly failing the people who use it.
The problem: SLAs measure the wrong thing
SLAs were designed to measure what a provider can control and prove (time to respond, time to resolve, percentage uptime). They're useful for holding a vendor accountable under a contract, but they were never designed to measure whether the service actually works for the person on the other end.
A ticket can be resolved in four hours and still represent a bad experience. Think stuff like three back-and-forth emails, a fix that didn't touch the underlying problem, or an employee who'd already given up and found a workaround. None of that shows up in a resolution-time metric.
Multiply that across thousands of tickets a month, and you get a service that looks healthy on paper while a meaningful share of the people using it have quietly stopped trusting it.
According to HappySignals' Global IT Experience Benchmark, employees lose an average of 3 hours and 18 minutes of productive time per IT incident.
That's not a rounding error hiding behind a service that's hitting every SLA it was ever asked to hit, and poor IT experience is now something nearly half of employees cite as a reason for leaving a job.
Here's the sharper version of the same problem: across a typical ticket population, a small slice, often around 13%, of tickets drives the large majority of that lost time, roughly 80%.
The HappySignals approach: find the 13%
If SLA data won't tell you which services are failing your end-users, you need a different measurement layer: One that asks the people actually using the service, close to the moment of use, instead of relying on an annual survey with a single-digit response rate.
HappySignals is built as an IT experience intelligence platform for exactly this: it pairs two connected metrics (happiness and lost tim) with your operational data, benchmarks it against comparable services, and uses AI to surface which specific tickets, services, and patterns are quietly costing you the most (the actual 13%).
A CSAT dashboard shows that the service is rated 74 this month. HappySignals tells you which tickets within that 74 are taking 9 hours to resolve, which issue types keep being reassigned between teams before anyone actually fixes them, and which of those patterns are worth fixing first. It doesn't replace your SLA, but it answers the question the SLA was never built to answer.
A common reaction here is "we already have CSAT built into ServiceNow."
That's true for most teams, and it's exactly the gap. CSAT tells you a score. It doesn't tell you that a specific issue type keeps bouncing between three teams before anyone actually resolves it, or that one category of ticket is quietly responsible for a disproportionate share of the lost time behind that score.
Reassignment is a good example: every time a ticket bounces between queues, the clock the SLA measures keeps ticking politely along, while the person waiting on the other end experiences something closer to being passed around. That pattern is invisible in a resolution-time metric and glaringly obvious the moment you look at experience data by issue type.
The HappySignals experience layer sits on top of ServiceNow, BMC, Jira, or whatever you're already running, connected to the tickets and workflows you already have, not replacing them.
The output isn't a parallel system to maintain; it's the missing diagnostic layer on the system you already trust for your ops.
Proof: what teams find when they look
Kris Scruby, Head of Service Design at Orbis, described the shift this way: "No more 'so what metrics' but a whole new spectrum of awareness and insight."
That's what happens once experience data sits next to operational data: The reporting stops being a monthly compliance exercise and starts being something you can actually act on.
What changes once you can see it
Once you have real visibility into experience, problems stop arriving as surprises.
Instead of finding out a service is struggling from an escalation or an offhand comment in a leadership meeting, you can see it trending in the data weeks earlier, while there's still time to fix it quietly rather than explain it publicly.
It also changes the conversation with leadership and with vendors. "Our SLA is green" stops being the end of the discussion and becomes the opening line of a better one: green on the SLA, and here's what the experience data says, and here's where the two agree or disagree.
That combination is a far more honest picture of service health than either number alone, and it's the picture that actually lets you do the job you were hired to do: Make sure the service works, not just that it's contractually compliant.
The services quietly failing your end-users are already out there, generating friction and eating productivity, whether or not your dashboards can see them. The only question is how long it takes to find out.
See where your lost productivity actually concentrates. Start with Discover and see the value in days, not months.

One insight a month, in your inbox.
New articles, benchmark data, and customer stories. No fluff.