Why IT Service Desks Need XLAs
This blog quickly explains why XLAs or experience-focused targets are the best indicator of how well an IT service desk is meeting business and employee needs.

IT service desk use of experience level agreements (XLAs) is becoming increasingly popular, with 2022 research by Axelos finding that only 9% of survey respondents thought their IT organizations would never see the need to improve the employee experience. Experience management is now part of many IT support reports, webinars, articles, and conversations, but what does an IT Service Desk Manager with experience management or XLA ambitions need to know?
To help, this blog quickly explains why XLAs or experience-focused targets are the best indicator of how well an IT service desk is meeting business and employee needs.
How is your IT service desk perceived?
The IT industry is awash with examples of IT service desks that have a disconnect between what their performance measures say and how end-users perceive their IT support capabilities. For example, when the CIO is challenged by their C-level peers armed with IT support horror stories.
It’s a strange situation because the IT service desk’s performance metrics report that the agreed-on service-level targets are met, perhaps exceeded, but some employees are still unhappy with their IT support interactions. This perception gap has been termed “the watermelon effect,” where performance metrics look green, but below the surface, there’s red.
Understanding the cause of the watermelon effect
The simple answer is that IT service desks can measure the wrong things from an end-user perspective and in the wrong places. For example, an IT service desk might measure its operational success – the “mechanics” of IT support – rather than the end-user experiences and outcomes. These often best practice metrics report how fast work happens and work volumes but fail to highlight the issues experienced by employees or perhaps even whether the required outcomes were delivered.
This perceptions gap (or expectations gap or experience gap) between an IT service desk’s performance measurement and end-users’ perceptions is exactly why IT service desks employ XLAs. They allow it to better understand how well business and employee needs are being met and can drive the required improvements to close the gap.
Using XLAs to highlight issues and improvement opportunities
The average IT service desk likely already has more performance metrics than it needs, so why would it add more?
Importantly, XLAs are not designed to measure even more operationally focused data points. Instead, XLAs should measure “what matters most” from an experience and outcomes perspective, such that improvement activities can be aligned to “what matters most” to employees and the business. It’s an important distinction, but IT Service Desk Managers must also understand that measuring performance just to show that service targets misses a key purpose of metrics – enabling the improvement of operations and outcomes.
Does your IT service desk need XLAs?
A telling question for IT Service Desk Managers and other IT support leadership roles is, “Are you confident your IT service desk measures the right things?” Even if the answer is “yes,” a good follow-up question is, “While key performance indicators (KPIs) show that all is good, does informal feedback highlight that employee needs are not being met?” Importantly, for the second question, it’s likely that if there are issues, there’s no insight into what’s causing them (after all, the existing IT service desk metrics don’t even highlight the issues).
This is why those managing an IT service desk need XLAs and the data and insight they provide.
“But our CSAT data tells us everything is great”
Customer satisfaction (CSAT) questionnaires and scores are often considered the “quality”-based balance to operational IT service desk metrics such as “average handling time” and “cost per ticket.” However, your CSAT score might not show what employees feel about the services and support they receive. Especially when a CSAT questionnaire asks questions related to the “mechanics” of IT support rather than the employee experience.
A quick way to demonstrate the need and opportunity for IT service desks is through some of our latest aggregated customer experience data. The insights are valuable, but it’s also worth remembering that this data is for a wide spectrum of customer organizations, some of which have already significantly improved employee experiences. So, the data for an IT service desk yet to start with experience management will likely be worse.
Some key experience data insights from 2022
The example IT service desk experience data and insights shared below are from The 9th Global IT Experience Benchmark: H2/2022.
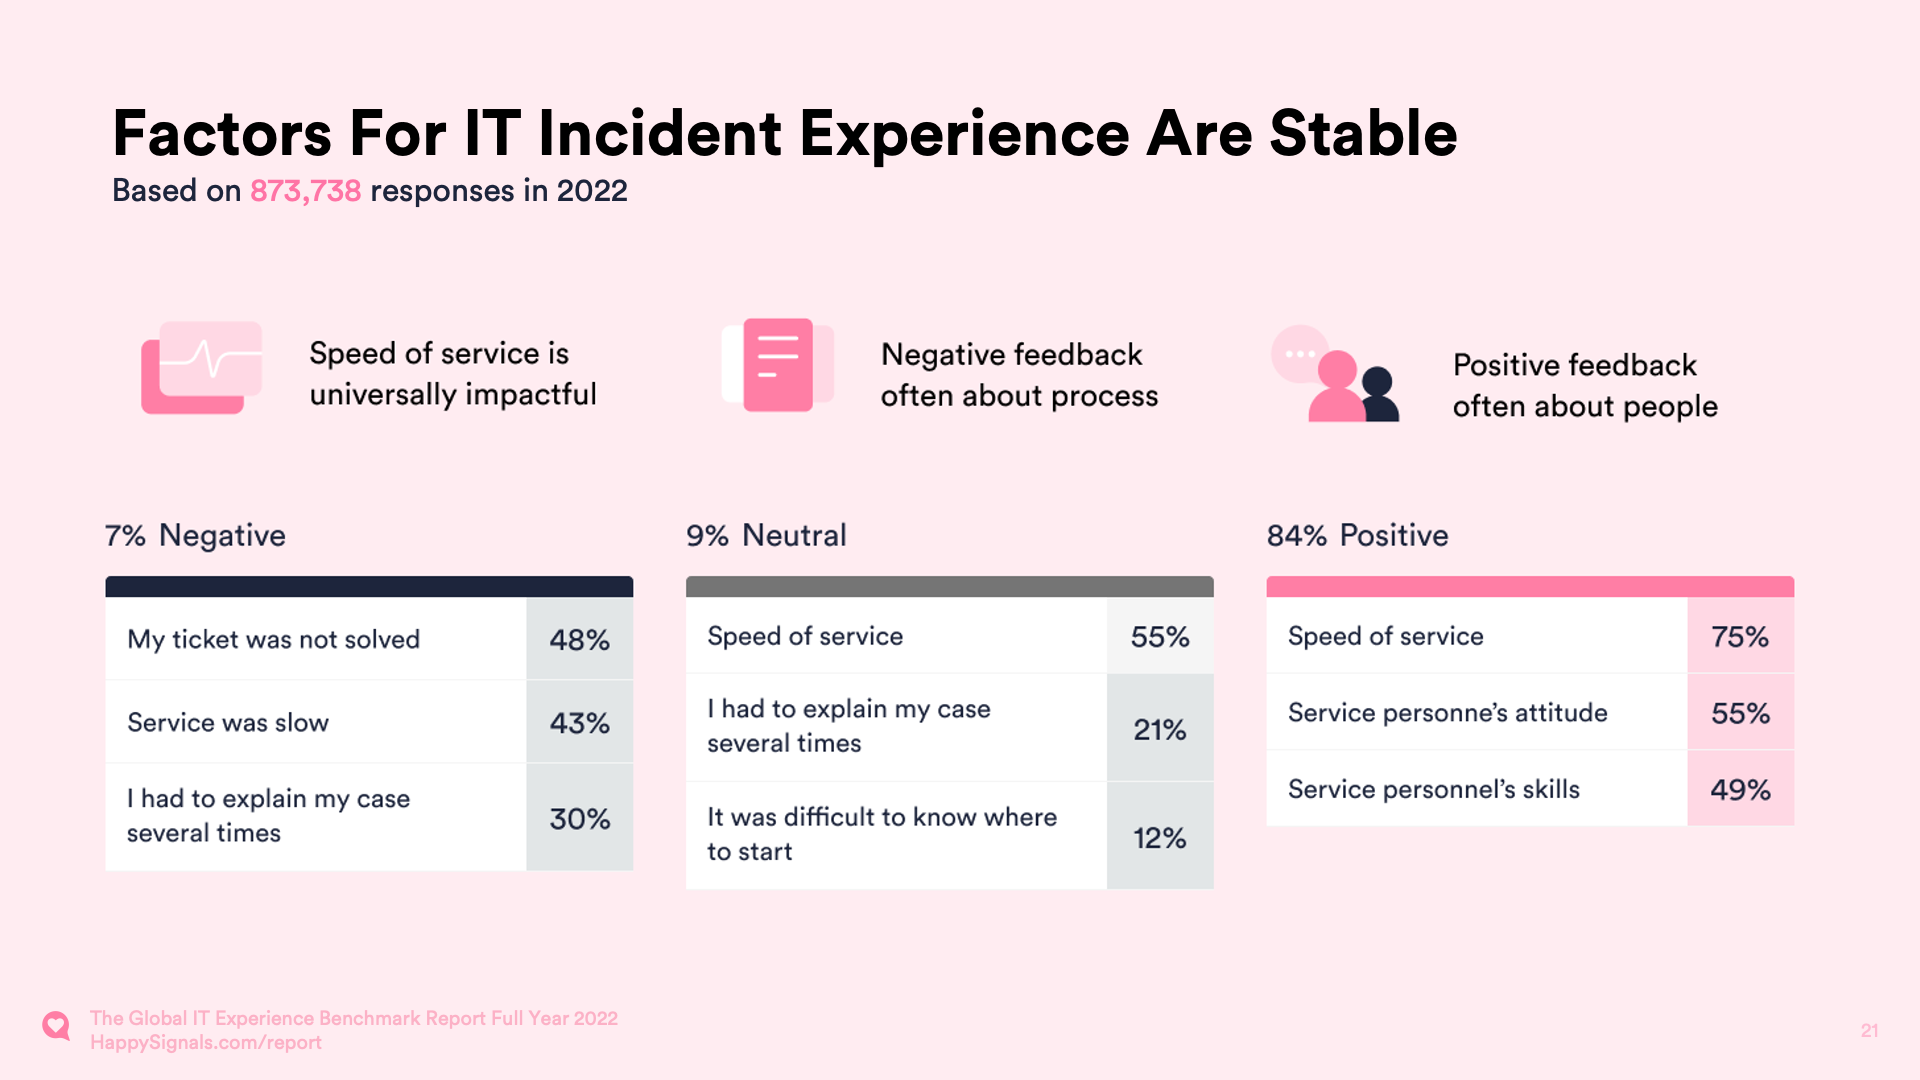
The first example relates to the key factors that lead to positive, neutral, and negative incident management experiences. While the positive factor reasons are likely known by your IT service desk, what about those for neutral and negative feedback? Especially the level of “My ticket was not resolved” and “I had to explain my case several times” responses. Both insights offer opportunities to improve experiences and employee productivity.
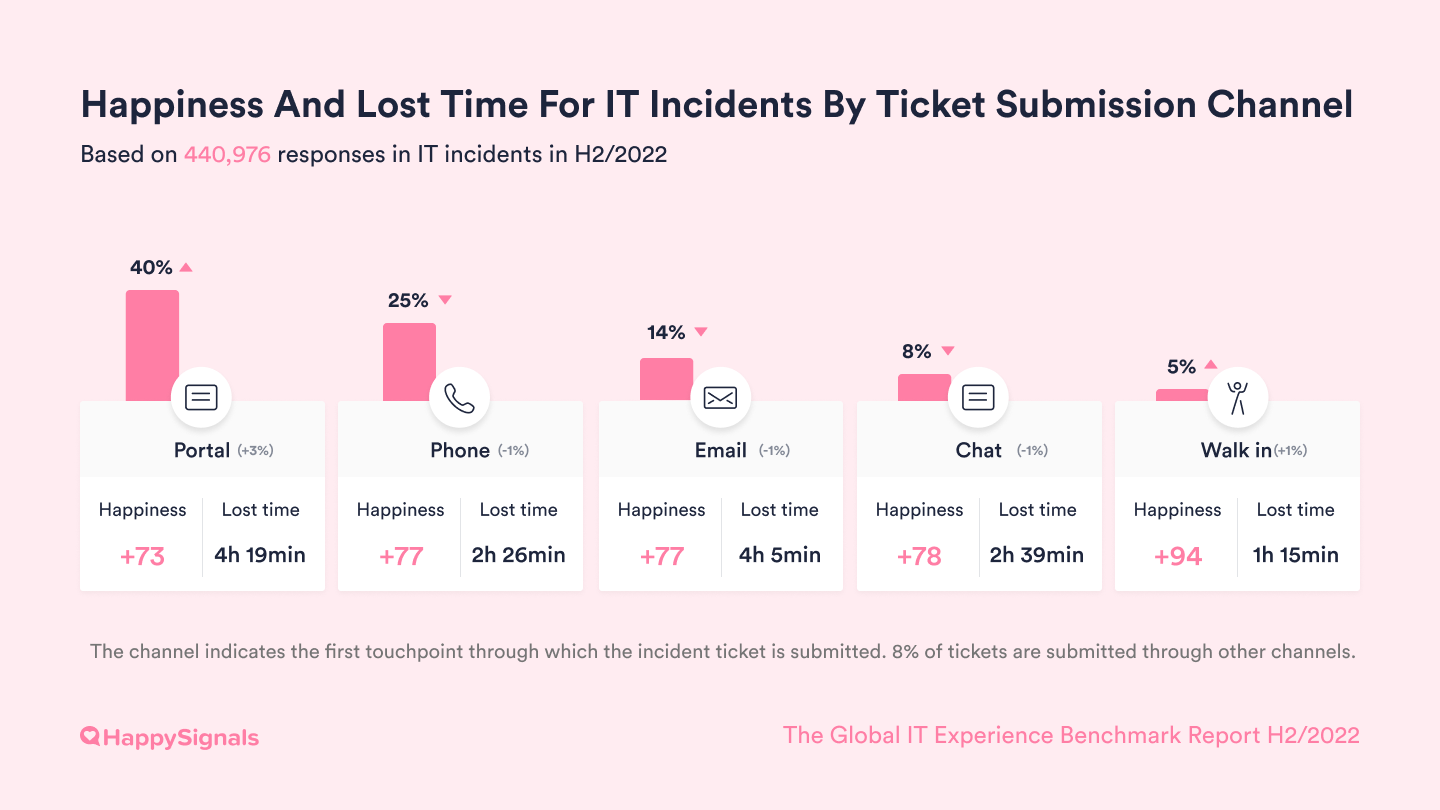
The second example relates to the relative success of IT self-service capabilities as an IT support channel. While the portal is the most used channel for IT support, it offers the worst employee experience (a Happiness score of +73), and employees perceive themselves to lose significantly more time (and productivity) than when using the phone channel – nearly two hours per ticket. It’s not delivering the promised self-service benefits related to “better, faster, cheaper.”
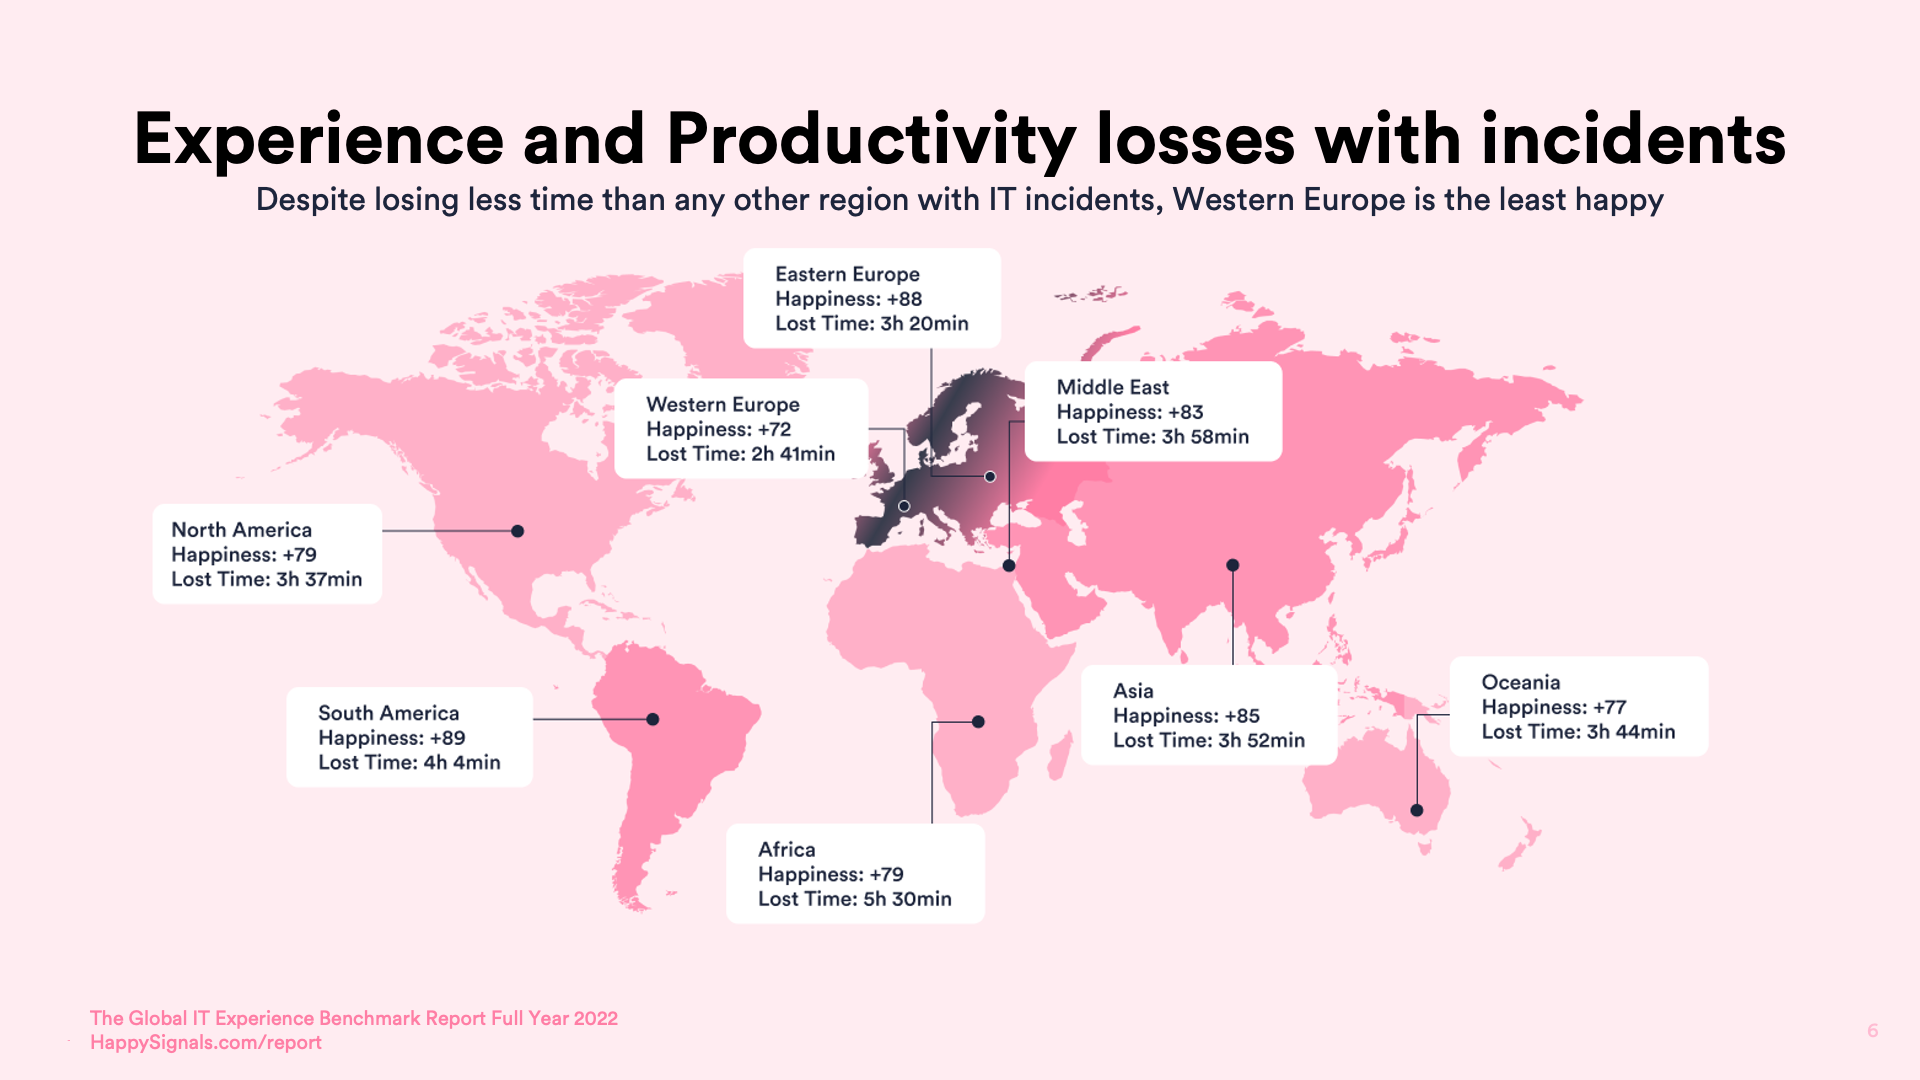
The third example is for global IT service desks. The chart below shows how experiences and expectations vary by region. For example, Western European end-users are the most critical of their incident handling (scoring +72) despite losing less time (2h 41min) than those in other regions. And South American end-users are the happiest with their incident handling (+89) despite losing more time than all the other regions except Africa. Understanding these differences is important when improving a global IT support capability.
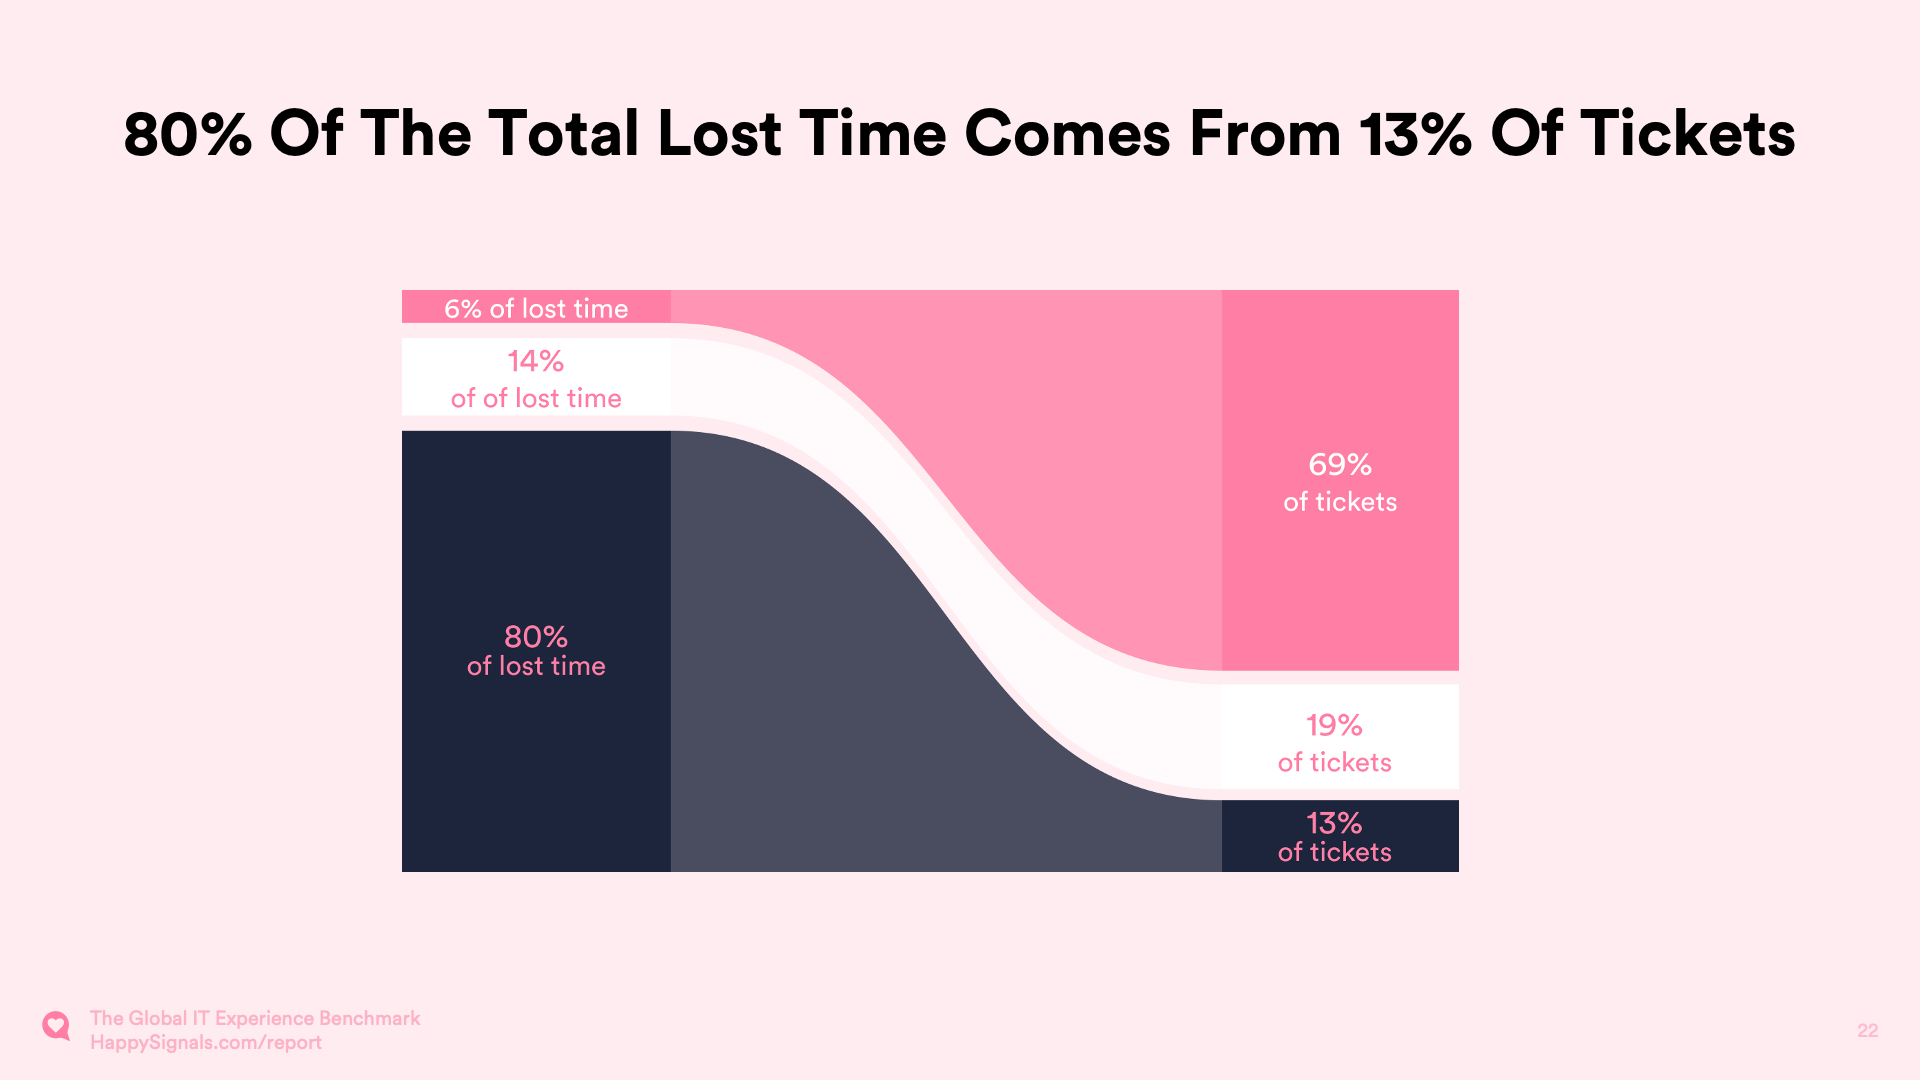
The final example will hopefully be a “mind-blowing” insight for many IT Service Desk Managers – that 80% of employees perceived lost time comes from only 13% of incident tickets. This granular insight allows IT service desks to move away from a focus on the average lost time to understand the types of incidents and root causes that cause employees to lose so much time and productivity.
Your IT service desk needs XLAs
You could ask yourself, “Do our current IT support metrics provide this quality of data and insight?” But a far better question is, “How have our IT service desk metrics, including CSAT scores, improved IT support for employees in the last two years?”
Through XLAs, your IT service desk can better understand what’s happening for employees – good, neutral, and bad experiences – at key employee touchpoints. Such that issues and performance are known, and future investments in IT support improvements can be made in the right places. Especially to address the underlying root causes of issues rather than the more visible symptoms.
If you want to learn more about how XLAs and employee experience management will help your IT service desk improve its operations and outcomes, please take a look at our Practical Guide to XLAs.
Related content

17.06.2025
The Compliance Nightmare – When IT Experience Debt Compromises Security
I think most IT professionals are acquainted with the term “technical debt,” the future cost of additional rework or ...
Read more >