

How to Create the Business Case for IT Experience Management
This blog explains why and how IT experience management pays for itself in return on investment terms.

Employee or end-user happiness has a business case. Yes, really. In this blog, I explain why and how IT experience management (ITXM™) pays for itself in return on investment (ROI) terms. It’s why HappySignals and Thirdera are helping an increasing number of organizations to measure their IT end-user experience to get them working in a end-user-centric way that ultimately delivers better business operations and outcomes.
The experience management business case
For an organization to start its experience management journey, it’s likely to need a business case that justifies the addition of new capabilities and the associated costs in quantifiable-benefits terms. However, with ITXM, there’s more to consider than a simple technology business case that looks at the ROI of project-based change – that if we spend X, we save 3X through greater efficiency. The benefits of ITXM affect more than IT operational costs. In fact, some IT operational costs might increase marginally, while the most significant benefits are reaped not in IT but as significant business-level savings.
The key to creating an experience management business case (and succeeding with experience management itself) is focusing on business outcomes rather than simply assessing the mechanics of operations. This focus allows organizations to move from measuring traditional operational metrics, that look at speed and volumes, to better understanding what’s being achieved (not what’s being done). This is an area where assistance from a partner like Thirdera, especially early in the process, will help to process your organization’s experience management journey more quickly.
But, importantly, the introduction of experience management capabilities is far more than a new set of metrics and associated improvements. It also drives a change of culture – moving organizations from service-centricity to people-centricity where a better end-user experience means less lost productivity and improved business operations and outcomes. This is where HappySignals’ partners such as Thirdera excel, assisting organizations in becoming the organizations they need to be.
Focusing on what matters most to end-users
Some people might associate end-user experience with happiness. It’s part of it, but there’s a need to appreciate that this happiness is significantly influenced by an end-user’s ability to be productive. i.e.: To do the work they need to do when they need to do it.
Our millions of end-user feedback responses show that the level of end-user happiness and productivity are linked. The less productivity end-users lose when seeking IT assistance, the happier they are. Importantly, the hard benefits of your experience management business case are easier to define through a productivity lens.
Of course, happy employees are more likely to be motivated, focused, and keen to stay with an employer. These can be soft benefits within a business case, but hard benefits can also be found in some instances. For example, the recruitment and training costs saved by lowering staff turnover. But it’s the financial value of employee lost productivity where the most significant hard benefits for an experience management business case will lie. Again, assistance from a partner like Thirdera, will help your organization to quickly build the business case for your experience management needs.
Reducing end-user lost productivity
Experience management data can be used to improve far more than incident management and service request handling in IT, both in terms of end-user happiness and productivity. For example, your organization can use it to gauge the suitability of its IT services in enabling end-users and business operations.
Your organization can use it to assess whether projects (even transformational programs) are delivering the expected improvements and not adversely affecting employee happiness and productivity. For example, the impact of moving to outsourced IT, or changing the outsourced service provider(s). Here, while the move was undertaken with the best intentions, it could adversely affect employees’ ability to work and thus business operations and outcomes. With granular experience data, your organization can see issues, where they are, and what’s causing them. This empowers stakeholders with the valuable insight needed to course-correct relative to the changes and their impact, as necessary. This actionable insight likely has a business value that far exceeds the acquisition.
Your organization can also use it to prevent suboptimal decision-making. An excellent example is a proposed shift-left strategy that moves end-users from telephone-based IT support to self-service capabilities. On paper, it might look great, with self-service promising all three of “better, faster, cheaper” service and support capabilities. However, as shown in our latest ITXM data below, if experience and feedback is not measured and personal likes and dislikes are not taken into account, this strategy is likely to degrade the employee experience in “happiness” terms and cost end-users productivity – with the use of the self-service portal causing nearly double the end-user lost productivity than with calling the IT service desk. Therefore, the move to self-service is neither better, faster, nor cheaper.
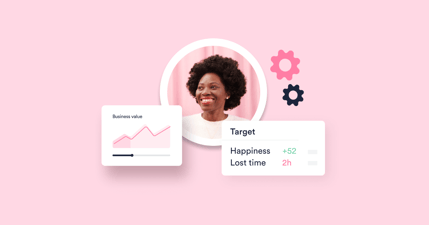
.png?width=1402&name=H22021-01-Measurement-Areas(1).png)
.png?width=1402&name=H22021-08-LostTime_by_Channel(1).png)
Quantifying the potential reduction in lost productivity
The key to assessing the ROI of experience management is understanding baseline of where your organization currently is and then determining where it could (and should) be. On average, when our customers start to use our product, their happiness score is +57. The global benchmark average in H2/2021 is +77. So, there’s a significant improvement opportunity for organizations when they address employee experience issues. Remember, the score of +77 is the average for all our customers, new and old. Hence, even higher scores are possible over time.
This change in happiness score can be converted into a lost-productivity reduction figure using our rule-of-thumb that an increase in happiness of ten points is equivalent to a 40-minute reduction in lost productivity. This rule-of-thumb can be used as the backbone of your experience management business case.
Let’s assume your organization anticipates increasing its happiness score by 15 points, saving an hour of lost productivity per ticket. It can calculate the ROI benefits based on the number of tickets handled per month multiplied by the average hourly employee cost.
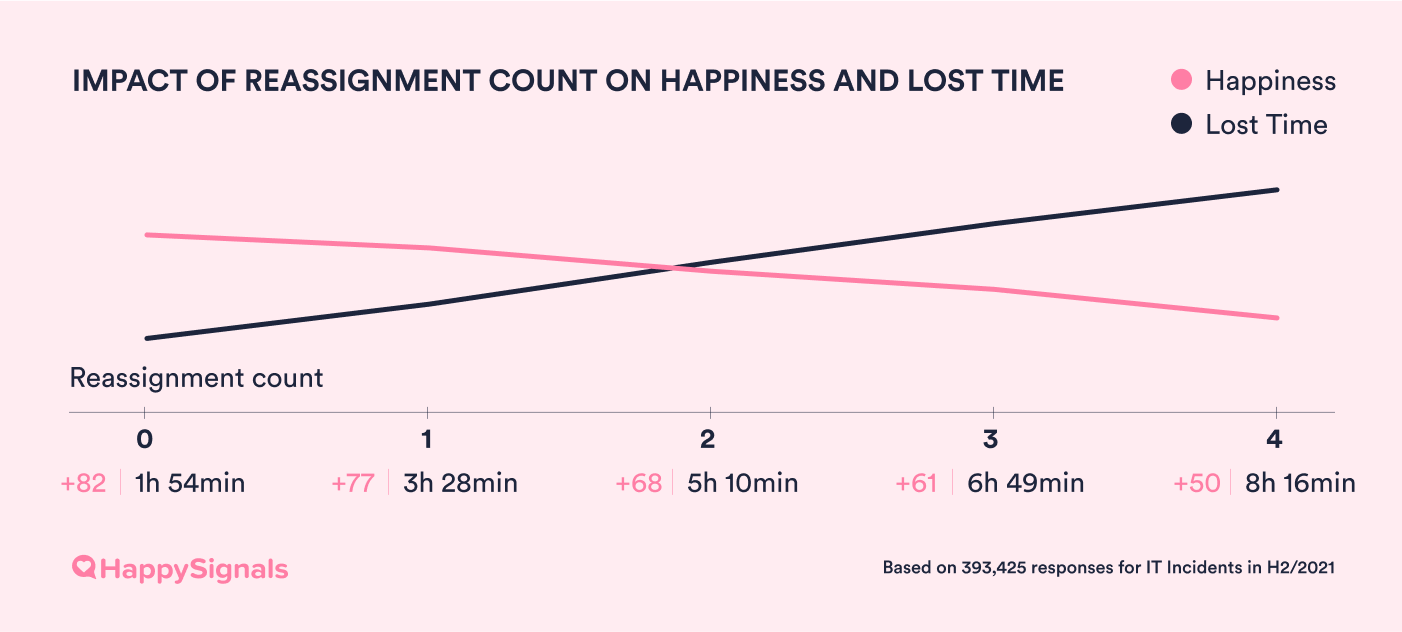
There are also specific target areas that can be focused on to improve the experience, reduce the lost productivity, and drive up the ROI calculation. For example, enhancing self-service capabilities in line with employee wants and the common factors that are losing them productivity. Or addressing the common causes of tickets “bouncing” between resolution groups where every reassignment loses happiness points with an increase in lost productivity (as shown below). Our feedback data shows that 45% of tickets get bounced at least once. This is a recurring area for improvement that delivers time and financial savings for both the service provider and the service receiver. Thirdera can help your organization to leverage experience data to remedy these and other potential service delivery and support issues.
But remember to account for “the differences”
It’s all well and good dealing in averages when creating your business case. Still, the closer the business case for experience management can represent your organization, the better it stands up to scrutiny. Three areas to consider are:
- Company industry
- Global differences
- End-user personas
The millions of pieces of end-user feedback from our global customer base allow us to identify statistically-proved differences across groupings in all three instances. For example, in Finance and Public Sector, it’s easier to make end-users happier with IT.
The country’s culture also significantly influences how end-users view services and rate them. For example, end-users in China score far higher (+92) on average than those in Germany (+59). This difference needs to be considered for organizations operating in a single country, as well as ones that operate globally, when they have the same service for all locations, but the local culture affects the scoring.
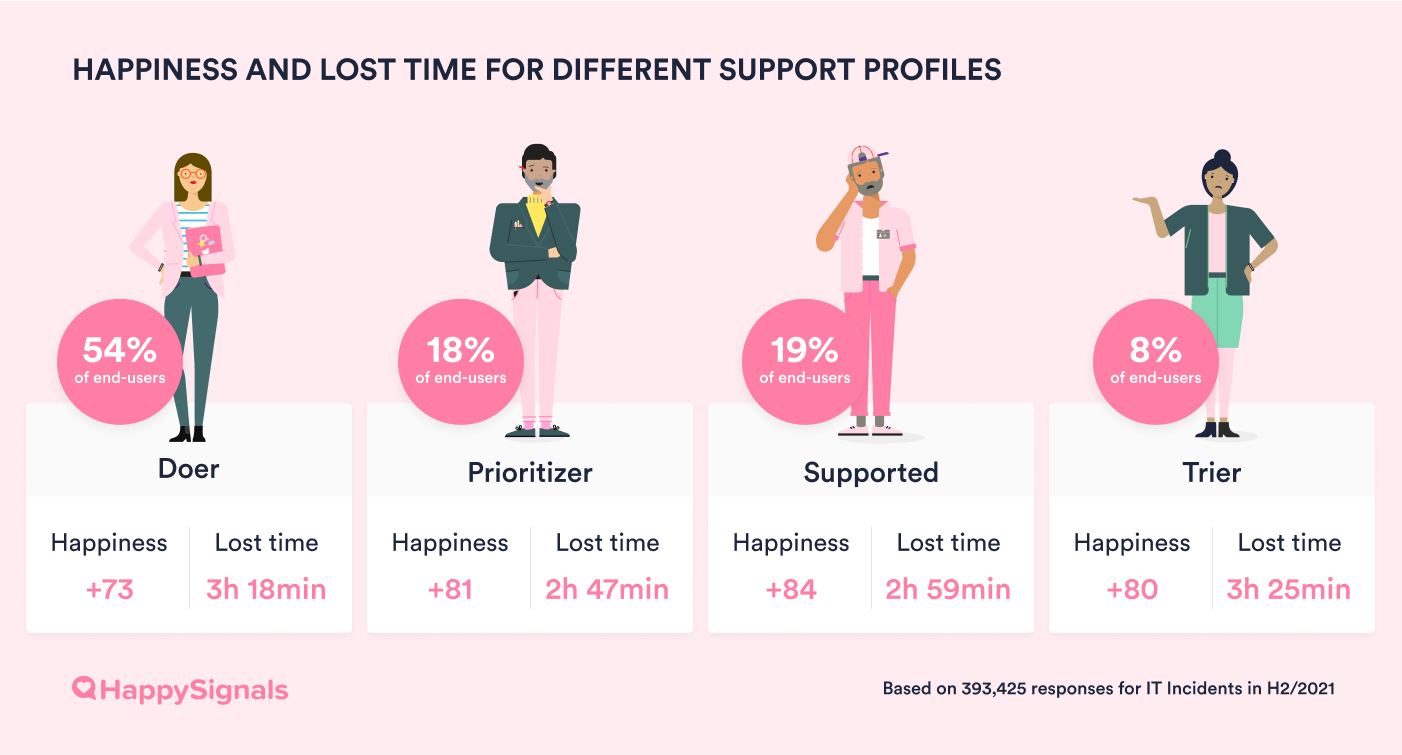
Finally, at HappySignals, we capture data for four distinct types of IT end-user support profiles: Doer, Prioritizer, Supported, and Trier. These profiles have different needs and wants when interacting with IT support and services, with different expectations that will drive their experience. For example, on average, 54% of end-users contacting IT service desks are “Doers.” These Doers can solve IT-related problems themselves and are often asked by colleagues for help. Hence, when Doers seek IT support, they want and expect expert help. Your organization can also bring this detail into its ROI calculation if warranted. It’s another area to engage Thirdera for help in creating your experience management business case.
You can hear more about creating the business case for experience management in more detail as part of this Thirdera webinar called “The Art and Science of Experience Management.” Please contact us to learn more about how HappySignals can help your organization, including calculating the ROI of experience management.
Related content
21.11.2024
Using ITXM in Other Business Functions
As the name suggests, IT experience management (ITXM) is an experience management framework originally used to enhance ...
Read more >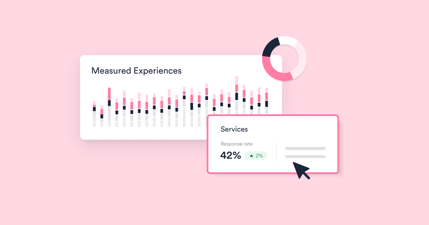
08.02.2024
The IT Experience Management (ITXM) Landscape
The IT experience management (ITXM) landscape currently has two dominant approaches. HappySignals advocates direct ...
Read more >