

Happiness Score™ - What would be a good score for your company?
"What would be a good score for our company?” There is no one-size-fits-all answer.
End-user happiness with IT vary across countries, companies, and industries. Understand how your company is doing in context and continuously improve the experiences you deliver to meet the evolving expectations of your end-users.

Earlier this year, we released The Global IT Experience Benchmark H1/2021 report, previously known as the Happiness Score™ report. It presented our latest findings about end-user IT happiness and productivity, based on almost 1 million end-user responses from our Enterprise customers who use our leading IT Experience Management Platform.
Over time a very common question I receive is "What would be a good score for our company?"
Well, my honest answer is “It depends.”
End-user happiness with IT vary based on a number of factors, so we cannot give a generic “ideal score” for every company.
In attempt to answer this question, this blog explains how the scores differ across countries and cultures, companies big and small, and industries, from which you can better understand how your company is doing in context.
First things first, what do the numbers mean?
If you read The Global IT Experience Benchmark H1/2021 report, you will have seen many numbers between -100 to +100, such as the one above. This and other such numbers reflect average end-user happiness with IT, and are calculated in the same way as a Net Promoter Score (NPS).
So for example, if 10% of all end-users rate their experiences negatively (with a score of 0-6), 20% rate them neutrally (with a score of 7-8), and 75% rate them positively (with a score of 9-10), the overall score would be 75-10 = +65.
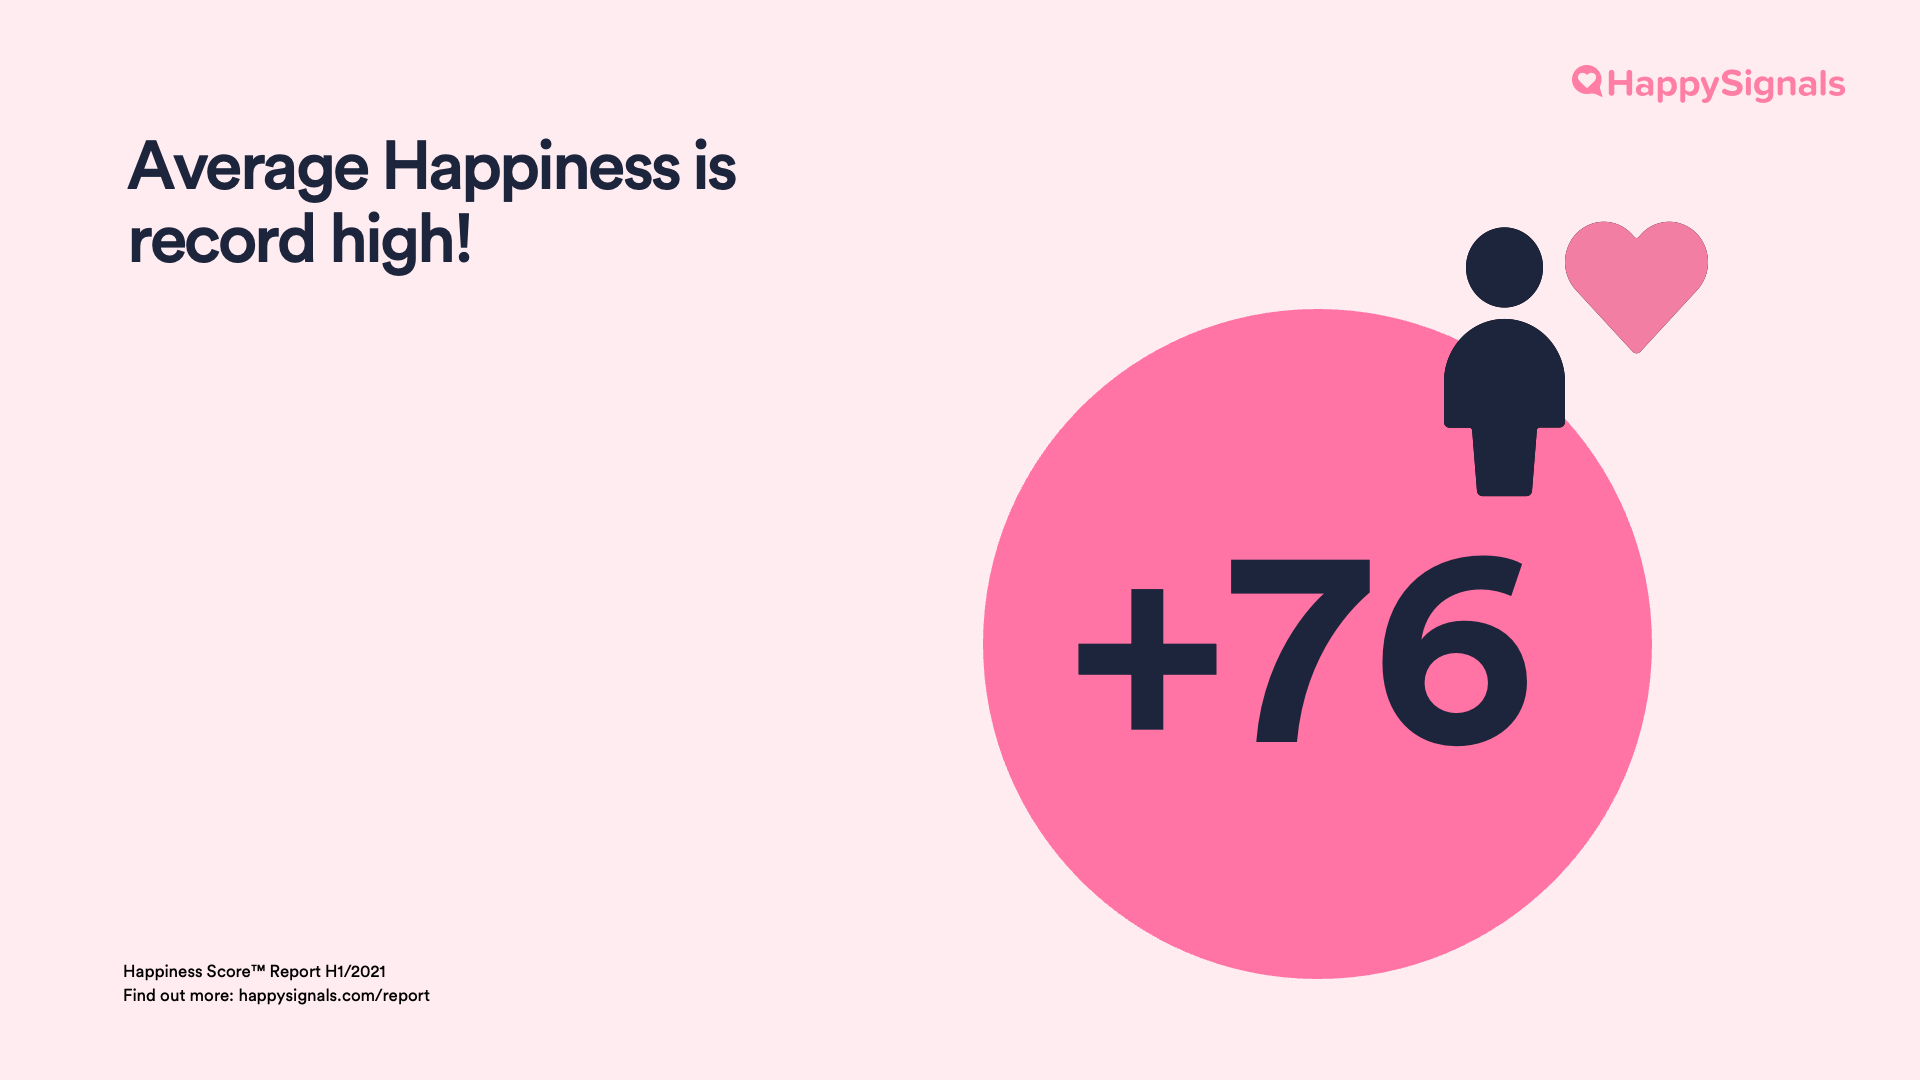
In H1/2021, the average happiness (based on all end-user responses from HappySignals’ customers), is at a record high of +76! This means that most end-users are rating their IT experiences with 9 or 10. Hence on average, our customers are doing really well in supporting end-user happiness with IT.
But let’s dig into how different locations, company circumstances, and industries influence such scores, so you can understand what your company’s score actually means.
End-users in happier countries are harder to please?
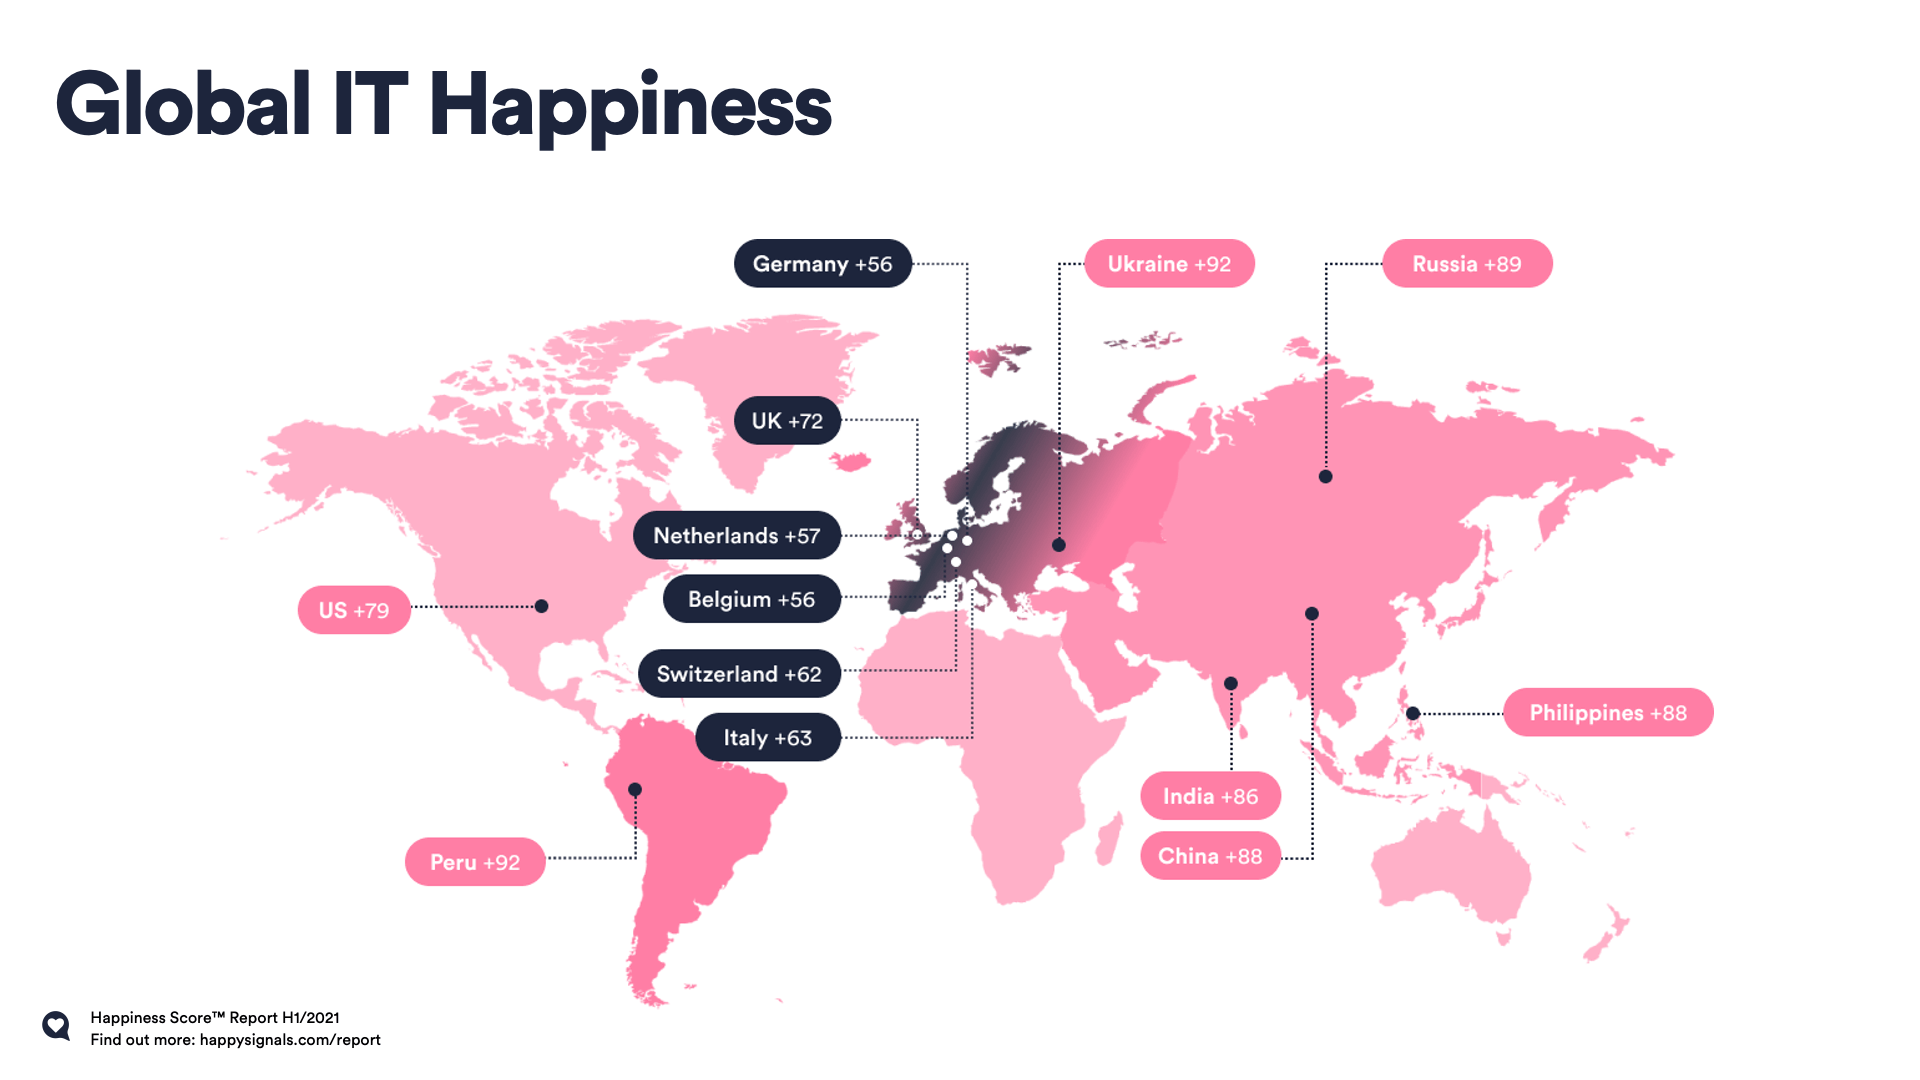
End-users rate IT services in ways that reflect their different cultural contexts; +70 may be above average for end-users in Italy but below average in India, for example. Hence, comparing your company’s score with country-specific averages can give richer insight into how your end-users actually feel about IT.
Based on data from our customers, two patterns surfaced. First, end-users in Western Europe are most critical when rating IT services. Average happiness with IT in countries like Germany, The Netherlands, and Belgium for example are only +56 or +57, implying that end-users are giving 9s and 10s much less readily than, for example, in Ukraine, where the average happiness with IT is a much higher +92.
Second, crossing our data with the "Happiest Countries in the World 2021" rankings, the higher a country ranked, the lower the happiness of their end-users with IT. It might be that end-users who are happier in daily life also have higher expectations for IT services at work.
So, benchmark your company’s score with averages in the countries where your end-users are. If it deviates from the benchmark by more than 5%, then you are either doing something extremely well or have areas for improvement.
Find out more about country-specific differences, including in perceptions of Remote Work, in the full Global IT Experience Benchmark H1/2021 report.
Internal or Outsourced Service Desk?
Does your company have an internal service desk for IT, or an outsourced one? That might influence your end-user happiness too.
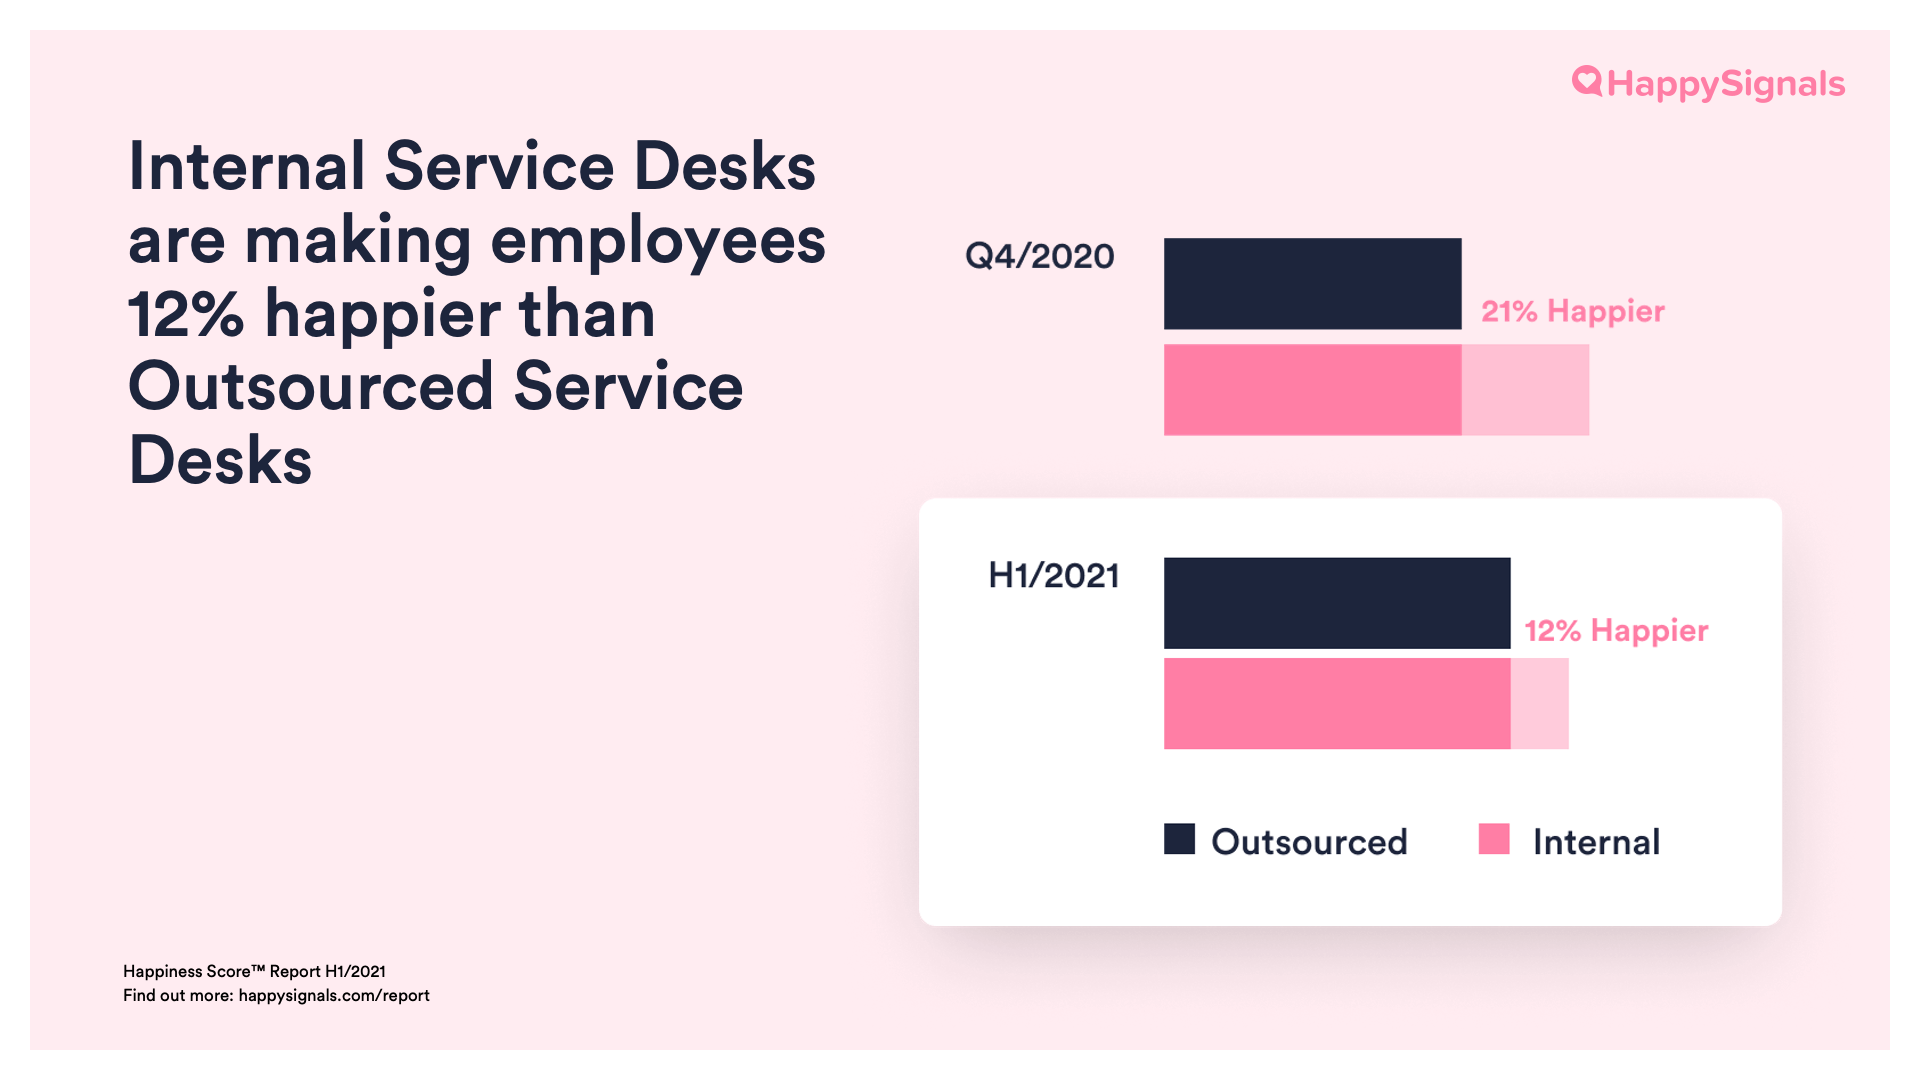
As of H1/2021, employees in companies with internal service desks are 12% happier than those in companies with outsourced service desks. However, the gap has reduced significantly since Q4/2020, when it was 21%.
Outsourced service desks are potentially working harder on using experience data to improve their services, and are hence catching up with internal service desks.
So even if you have an internal service desk and your scores look alright, it isn’t the time to be complacent. After all, the ultimate aim of collecting experience data is to continuously improve on the experiences you are delivering to your end-users.
Size matters.
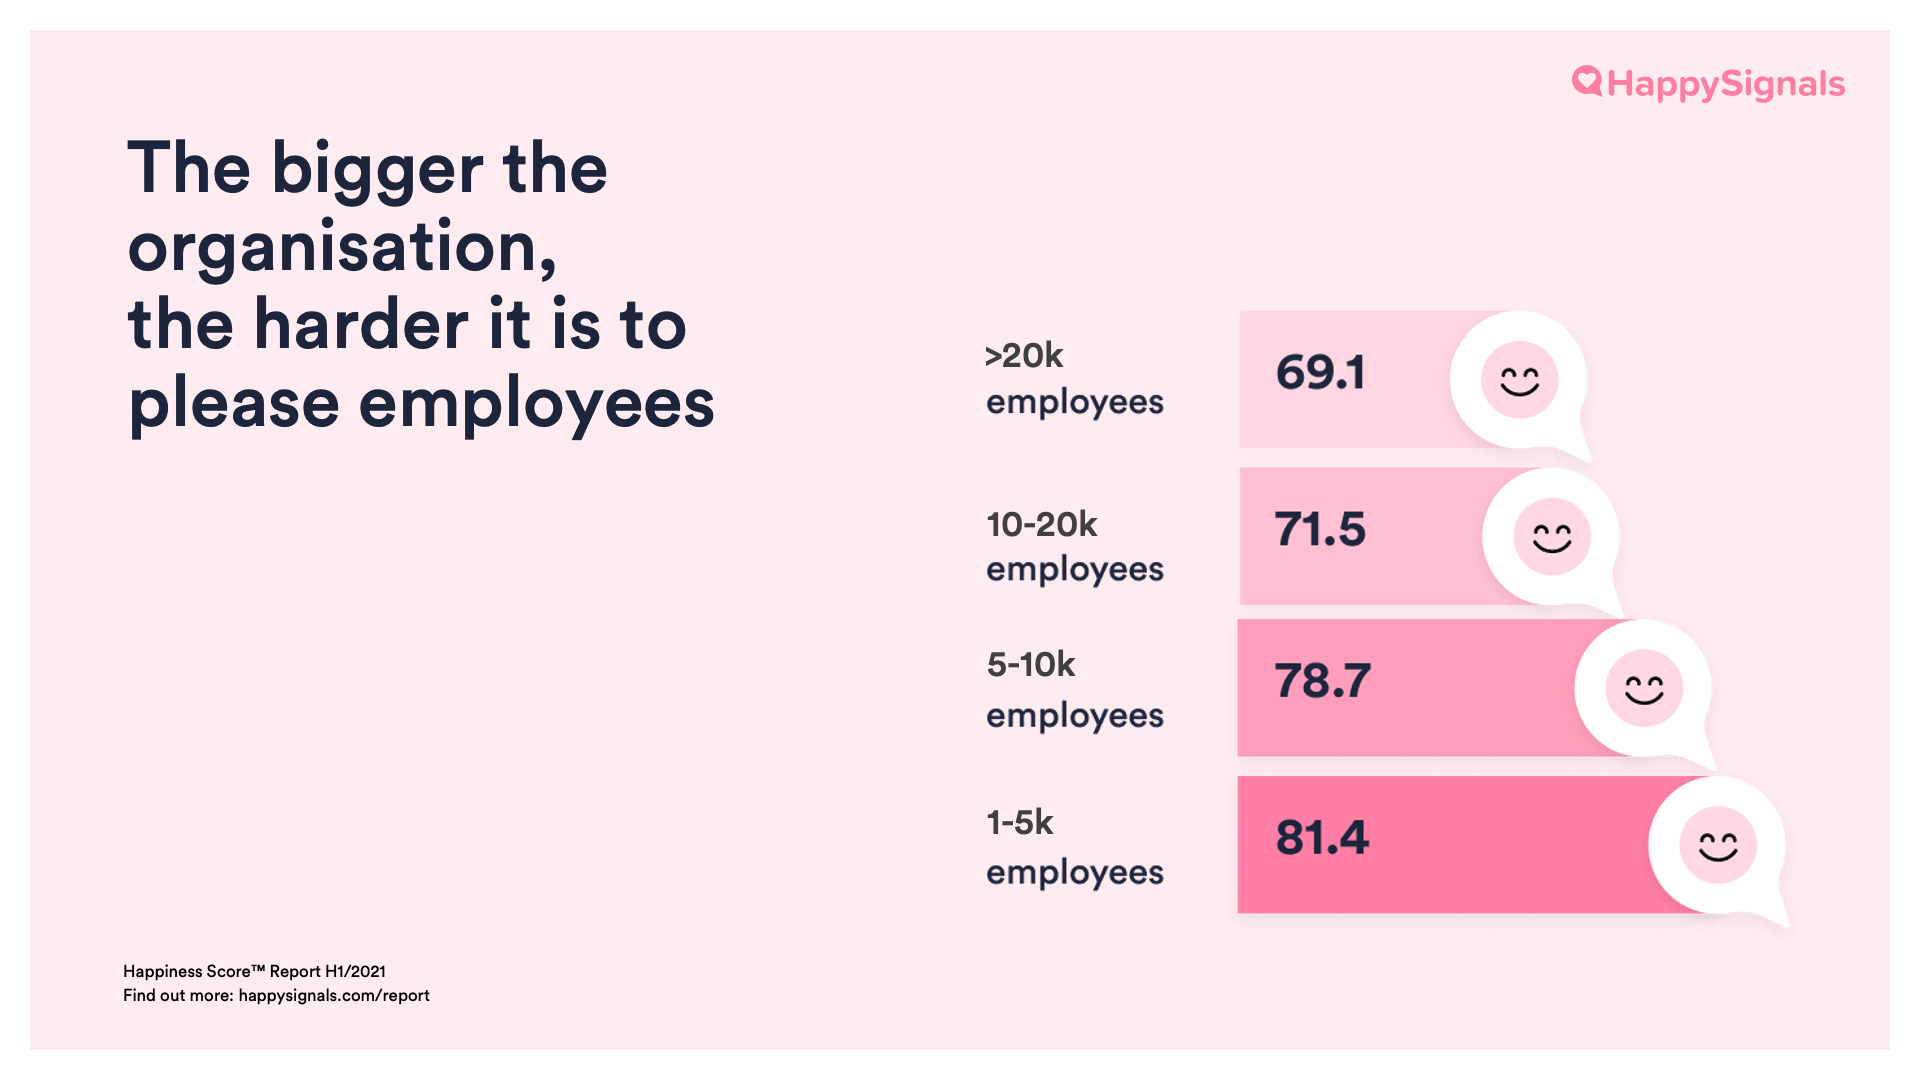
Bigger companies with more employees achieved lower end-user happiness with IT than smaller ones. It seems like in bigger companies, it is more difficult to make end-users happy. But there are several layers to this.
Amongst our customers, only 33% of smaller companies with less than 5000 employees have outsourced their service desk, but up to 73% of bigger companies with more than 5000 employees have outsourced their service desk to an external vendor or Managed Service Provider (MSP). Hence, the differences in happiness may also relate to the differences in happiness between internal or outsourced service desks, which I mentioned earlier.
Interestingly however, outsourced service desks are also performing better for the bigger companies. Hypothetically, this could be because MSPs may be better at providing services at the right time zone for employees of big international companies, or be more focused on serving you if you are a bigger company.
In short, the data as of H1/2021 shows that it makes sense for smaller companies with less than 5000 employees to stick with internal service desks, while outsourcing works better for bigger companies.
Some industries have more critical end-users?
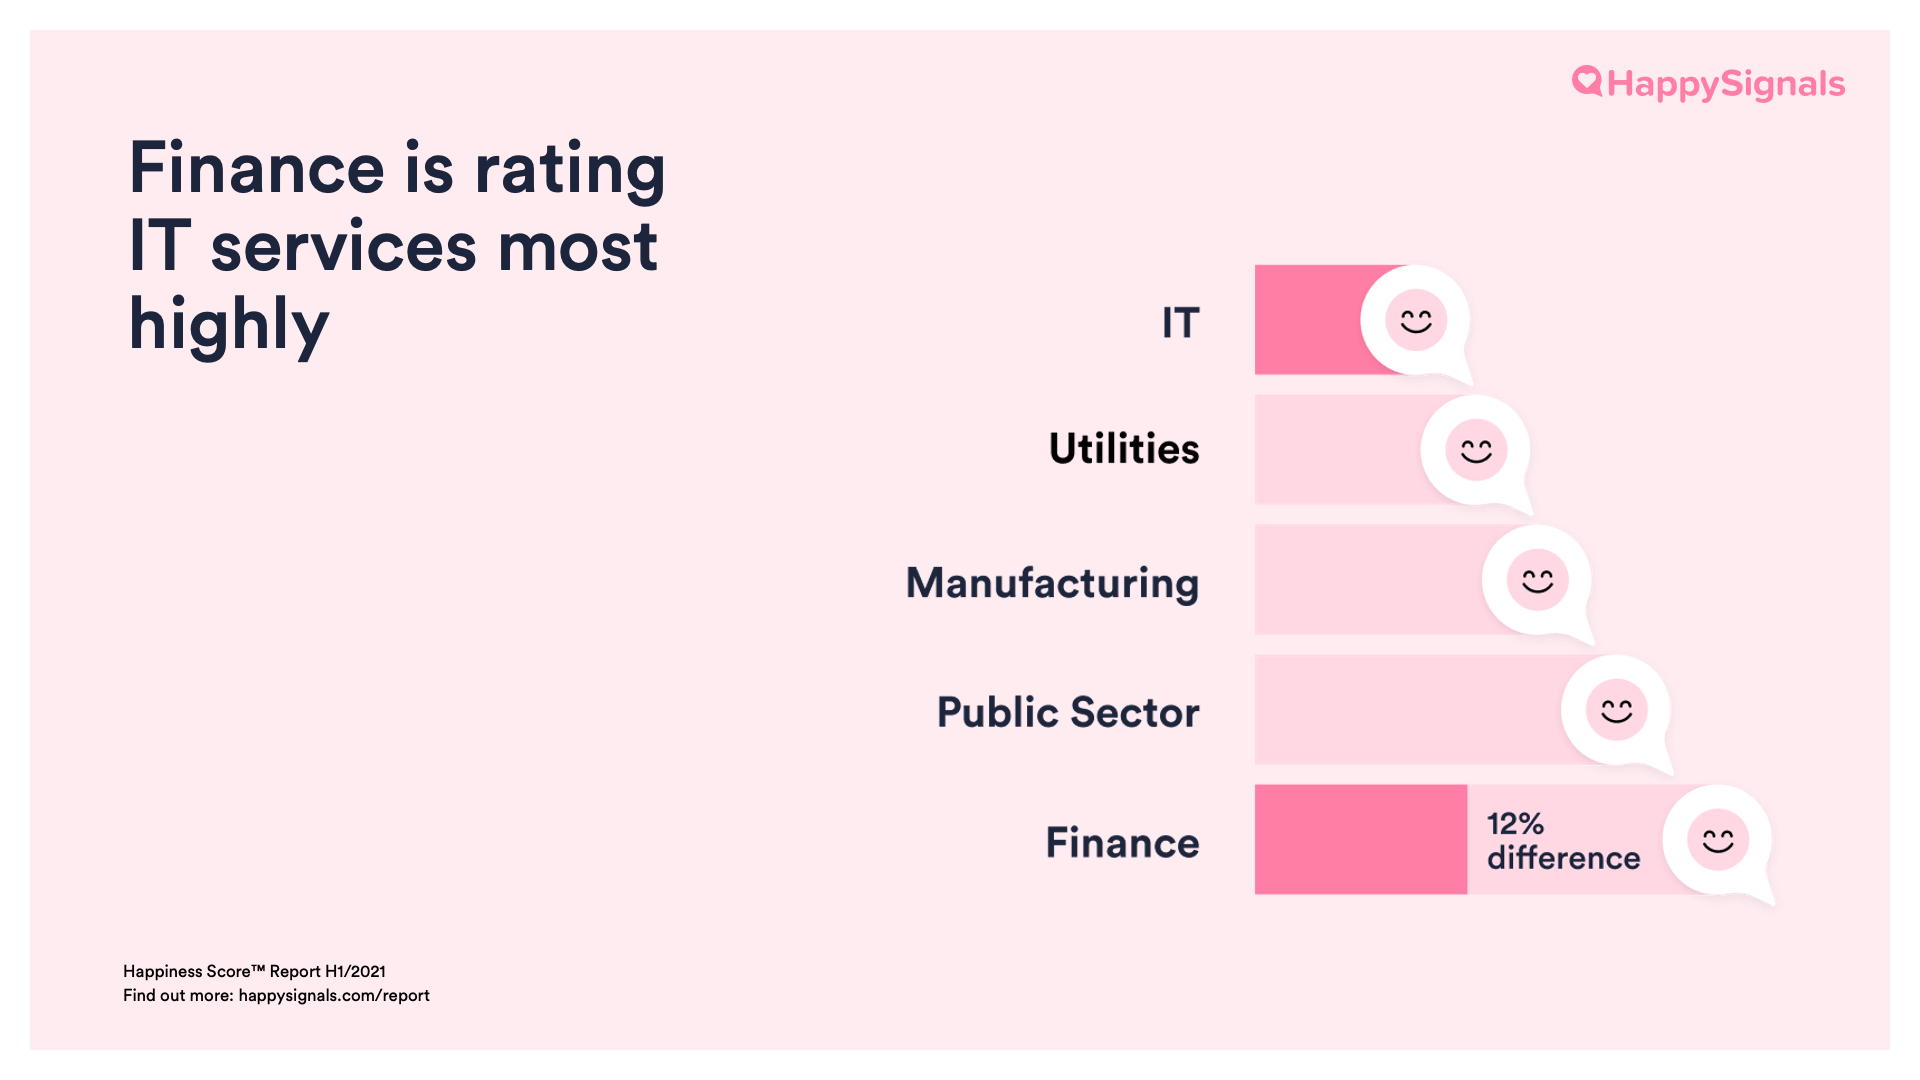
Among our customers, average end-user happiness with IT seems to be lowest in the IT industry and highest in the Finance industry, though the difference is only 12%.
My hypothesis is that many end-users who work in IT tend to be of the support profile that we call “Doers” – technically capable and able to solve simpler IT issues on their own. Hence, such Doers only go to IT for support for more complicated problems, which are also harder for IT to resolve.
It is hard to say why end-users in Finance are happier with IT on average, and I would love to hear your opinions as well. One possible reason could be that the Finance industry is one of the more regulated ones here (alongside the Public Sector). It may be easier to establish and provide standardized services when technological changes occur less rapidly.
Experience Management is not about chasing a “good score”
I hope this blog has helped you to understand your scores in context with the differences in end-user happiness that we found across countries, companies, and industries.
But again, I want to emphasize that you should not treat this as a competition to get a better score than others, or it would be nothing more than a vanity metric. Rather, use experience data to understand changes in your workforce’s expectations and continuously improve on the IT services you provide to them.
If this short blog has been insightful to you, do check out The Global IT Experience Benchmark H1/2021 Report for our full analysis and to see more of the data for yourself. As always, I am happy to answer questions or have more discussions about any of our insights, so feel free to contact me via Email or Linkedin.
I also talk about this topic in the latest episode of ‘Happy in 15’, featuring a special guest Frank, our Office Dog! Watch it below.
If you enjoyed watching this, be sure to subscribe to Happy in 15 and never miss an episode. If you prefer to read than watch, stay tuned for more blog posts like this one!
Looking for something even more bite-sized? Check out our recently released Learning Center, where we cover everything from XLAs to optimizing your ServiceNow.
Related content

6 minute read
09.07.2021
What makes Enterprise IT end-users happy in 2021?
In the past year, the COVID-19 pandemic has forced organisations to rapidly transition to remote work. Measuring, ...
Read more >
13 minute read
06.04.2022
The Common Continual Improvement Opportunities Identified Through Experience Data
When an organization aims to instill a culture of continual improvement, it’ll usually adopt formal improvement ...
Read more >