Helsinki February 24th 2022 – HappySignals, the leader in human-centric experience management for IT and creator of the IT Experience Management Framework (ITXM™) Framework, today released The Global IT Experience Benchmark Report (H2/2021). This biannual global benchmark report shares aggregated insights into various aspects of corporate IT performance – for both in-house and outsourced IT operations – to inspire organizations to target their continual improvement effort in the right places.
If you’re a CIO, IT Leader, or Service Owner that needs to deliver great IT experiences to end-users in 2022, then you need to start making informed improvement decisions based on experience data. These superior experiences drive better business operations and outcomes and ultimately improve the corporate bottom line.
The Global IT Experience Benchmark Highlights
In the latest Global IT Experience Benchmark Report, some of the key experience insights include that:
- Self-service Portals are no longer the least liked IT touchpoint – with the Happiness with Portals increasing from -18 to 0 in the past six months. Mobile Devices are now the lowest of the measured areas at -1.
- Portal is by far the predominant support channel for IT requests based on feedback responses – at 56% versus the telephone channel’s 11%. However, the Portal channel still offers the lowest level of Happiness across the support channels for IT incidents.
- For the first time in three years, employees lost less productivity per ticket when using the Portal than the Email channel for IT support services. However, they still state that they lose 78% more time than when using the Telephone channel for incidents.
- The top negative Factor for IT incidents is “My ticket was not resolved,” closely followed by “Service was slow.”
- With ticket reassignment, i.e. where the end-user is “bounced” between analysts or resolution groups, each additional time a ticket is bounced, Happiness falls by close to 8 points, while end-users lose 1h 38min more work time.
- There are still country-specific differences in end-user Happiness. For example, end-users in Ukraine are the easiest to please (+95), while end-users in Germany (+59) are the most critical of IT’s services. Thanks to the profiling of end-users, the data also shows that the countries with the lowest Happiness scores have a high proportion of technically-savvy end-users.
- Enterprises continue to get better at supporting employees in remote work. Happiness with Remote Work increased from 57 to 69 in H2 2021. However, remote or hybrid worker experiences remain complex and difficult to generalize. For now, no factors stand out as dominant influencers of positive or negative Remote Work experiences. Hence, collecting experience data from your organization’s employees is the only way to ensure that they’re happy and productive remotely.
These insights are based on almost 750k pieces of end-user feedback collected between July-December 2021 by customers that use the HappySignals IT Experience Management Platform. These customers include large enterprises and public sector organizations as well as Managed Service Providers (MSPs) who use the HappySignals Platform with their customers. It’s, therefore, essential to appreciate that these insights relate to organizations that are already addressing end-user experience issues rather than reflecting “average” IT organizations.
This difference is demonstrated in another set of report data points, that the average uplift in Happiness from the first two months of using HappySignals until H2/2021 is:
- 56 to 74 (a 33% increase) for companies with an Outsourced IT Service Desk
- 76 to 84 (an 11% increase) for companies with an In-sourced IT Service Desk.
“Organizations now realize the importance of employee experience. However, it’s usually difficult for them to understand the links between the IT services delivered and employee productivity. Experience data, as shared in this report, is the missing link that enables their improvement activities to focus on the things that matter most to employees and the corporate bottom line.” said Sami Kallio, CEO, HappySignals.
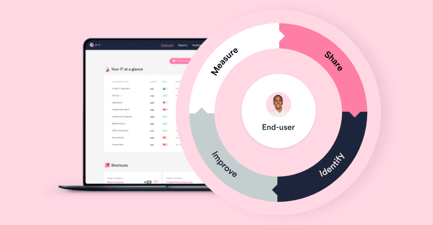
How the Experience Data is Gathered
HappySignals connects operational data from customers’ IT service management (ITSM) platforms with data from continuous surveys about Ticket-based and Proactive IT areas. HappySignals surveys ask questions related to:
- Happiness: end-users rate how happy they are with the measured IT area (e.g. recent ticket-based service experience, Enterprise Applications, Mobile Devices, etc.) on a scale from 0-10. HappySignals then use the NPS model to derive the Happiness rating.
- Productivity: end-users estimate how much work time they lost, i.e. productivity, due to the measured IT area.
End-users can also select the various Factors – from a list of suggested reasons – that influenced their Happiness rating.
For press materials, click here.
Media Contact:
Eva Taskinen
VP Marketing
eva.taskinen@happysignals.com
+358 -40 -552 9084