

The Financial Impact of Interruptions
Knowledge-worker productivity is the biggest of the 21st-century management challenges. – Peter F. Drucker
The retail industry has a word for it: shrinkage. It's the amount of inventory that disappears through shoplifting, loss, damage, or other causes. It's a complex problem to solve even though—for the most part—it is visible. Inventory is counted in and checked out, and the differences are noted.
In the modern, technology-enabled business world, there's another kind of shrinkage, too, and we're not talking about disappearing laptops or keyboards. We're talking about work shrinkage: Lost productive time for employees, and as Benjamin Franklin said in a 1748 essay, "Time is money."
For knowledge workers, it is not as straightforward as it is on assembly lines or in hard goods production; measuring a knowledge worker's output by the number of words, lines on a spreadsheet, or keystrokes says nothing about the quality of the work.
How does productivity loss happen?
Incidents are defined (ITIL® 4) as "An unplanned interruption to a service or reduction in the quality of a service." Either one—interruption or reduction of quality—has a negative impact on the people who use the service. It reduces their productivity, and a reduction in productivity costs the organization money.
The reduction can result in delayed projects, missed deadlines, and lost sales opportunities, but it also can slip "under the radar" when it simply means people are not working at their full capacity because their technology is letting them down. There is little doubt that these delays and reductions have a negative effect on employee motivation and engagement (more on this later). Unengaged or disengaged employees are less likely to meet or exceed productivity goals, while there is a strong correlation of employee engagement to multiple areas that may have a financial impact, Gallup research says, such as:
-
Better employee health
-
Greater profitability
-
Employee retention
-
Reduced safety incidents
-
Better customer experience
The Difficulty of Calculation
How can we calculate the financial effects of lost productivity? It's not easy. Here are some of the factors we should be thinking about:
- Business criticality – Not all work output has the same business value
- A marketing automation failure may delay or disrupt a new product release
- A project time-tracking application may not affect the progress of the project itself
- Productivity value - Not all interruptions have the same effect on the employee's work or perception of lost time.
The HappySignals Global IT Experience Benchmark Report for 2023 H1 (page 30) puts it this way:
Think of the ratio [of perceived] lost time to Time to Resolve (TTR) as an indicator of business criticality. If the ratio between how long a ticket is open and end-user perception of lost work time is high, it means that every hour the ticket remains open, a significant part of the end-user's ability to work productively is hindered.
There can be immediate financial impacts. In the US, the average hourly wage (January 2024) is $34.55, or $0.58 per minute, so for every minute of lost productive time, a business may be spending upwards of a half-dollar per affected employee per minute without getting the expected work in return. It doesn't have to be all the work, either. What matters is what they need to be working on now—the business-critical work.
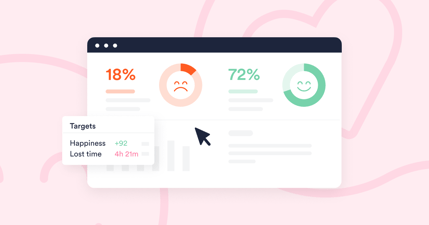
Remember that American employees report an average of 3 hours and 22 minutes (202 minutes) of lost time per incident and 4 hours and 22 minutes (262 minutes) per service request. At $.58 per minute, an incident can cost $117.16 per employee if both the lost time for the incident and the employee's wages follow the averages. Multiply by the number of employees affected, and the costs can become substantial.
As I have pointed out elsewhere, the perceived lost time often exceeds the Time to Resolve because employees perform tasks such as restarting the application, the computer, or both, searching the knowledge base, and asking colleagues before they report the issue to IT.
Of course, complete outages in critical applications can have enormous financial impact, but it's relatively easy to ignore the ongoing effects of diminished productivity. For example, if employee Rosanna has a deadline of 5 PM on Friday to produce a given report and she submits it on time, we only see that the work is being delivered on time. But what we don't see includes two-and-a-half hours of unplanned work on Tuesday evening (off-hours) that became necessary because the application she needed for her analysis was down when she had planned to use it. Rosanna notes it as lost time, which makes it visible in the experience data.
Negative effects of diminished productive time
Although, as the Global IT Experience Benchmark Report shows, there is not a direct correlation between lost time and unhappiness, repeated occurrences of having to work extra time to make up for degraded or broken services are likely to decrease Rosanna's enthusiasm and may have a negative effect on her loyalty to the company. If she sees herself having to put in extra time and effort for the same salary, and if the out-of-hours work begins to impact her family life, caregiver responsibilities, or other personal activities, she will be unhappy. If she decides to leave, there's a financial impact because it is very expensive to replace a skilled employee:
The cost of replacing an employee can be substantial, often amounting to 6-9 months of the employee's salary. This includes recruitment, onboarding, and training expenses. Hidden costs involve project disruptions, increased workload for existing staff, and potential morale decline. - Workable
Creating a productivity index
We can make the productivity question a bit easier if we create a baseline measure:
"Because productivity is a relative measure, it must be compared to something else for the data to be valuable. You may have a set of numbers representing your organization's productivity, but how do you know if those are good numbers or bad numbers? To understand your own organization's productivity, you must create a productivity index. This is the ratio of productivity measured in a certain period of time to the productivity measured in a base period. For example, if the base period's productivity is 2 and the following period's productivity is 2.3, the productivity index would be 2.3/2 = 1.15, meaning that your organization's productivity had increased 15%. By tracking these numbers over time, you can identify patterns and evaluate success or failure." – Kate Eby, Smartsheet
Gaining insight through analysis of employee experience data can help inform such an index, taking some of the "guesstimation" out of the equation and shedding light on the impact work interruptions have on the organization's time and, therefore, money.
Summary
While there is little question that diminished productivity costs organizations money, getting exact numbers is often difficult or not possible. Employee experience data can illuminate areas we usually don't see, allowing us to better prioritize work on business-critical applications and to see areas that may be damaging to employee morale. This is, as Drucker said, a 21st-century management challenge.
Related content
13.03.2025
How to Gain Senior Leadership Buy-in for IT Experience Management (ITXM)
As an IT professional working hard to deliver the IT services and support capabilities your organization needs, it’s ...
Read more >
20.02.2025
How to Make IT Experience Management (ITXM) Quick Wins
Quick wins have long been a staple in the IT service management (ITSM) space. An organization wants to do something ...
Read more >