IT Experience Management from Data to Action

Measure experiences, Share experience data, Identify improvements, and Improve what matters most – all on one platform.

Measurement Areas

Experience-driven IT Decision-making


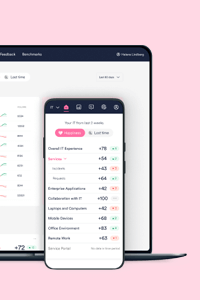
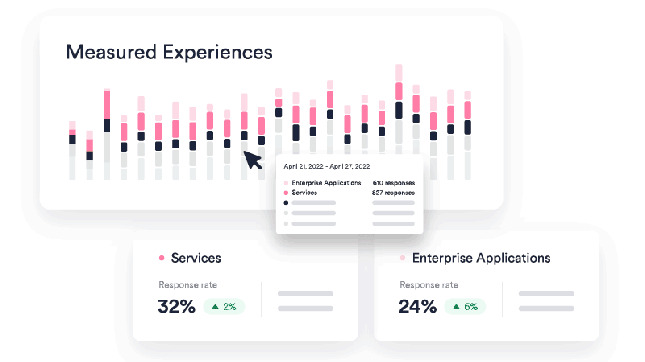
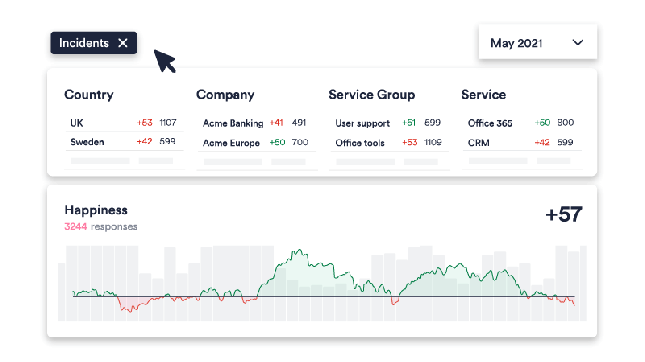
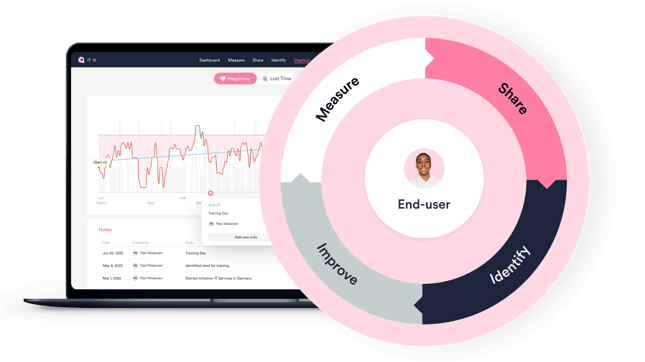
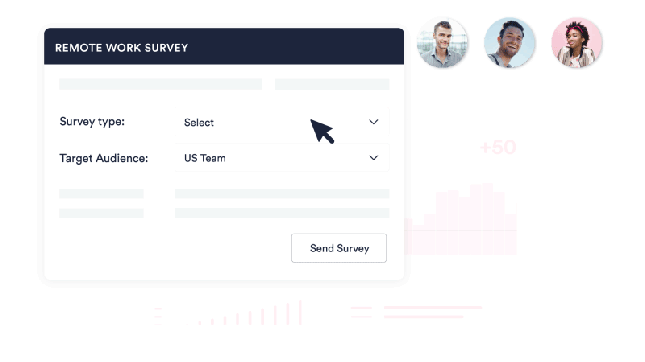
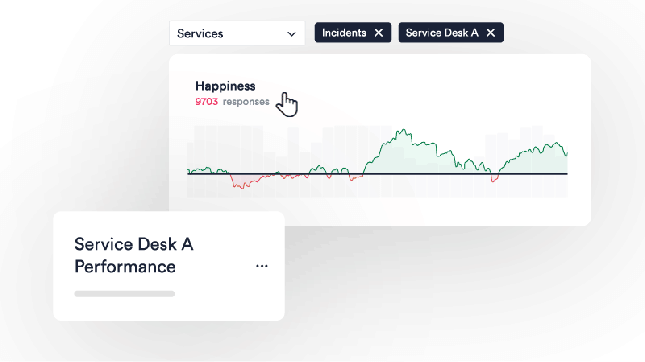
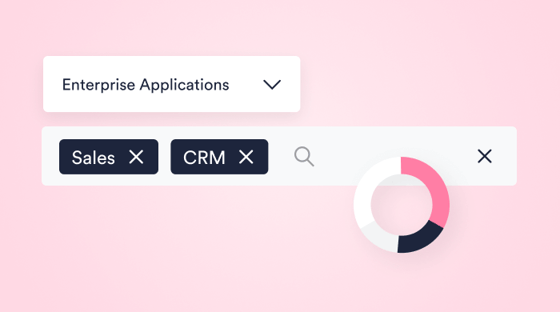
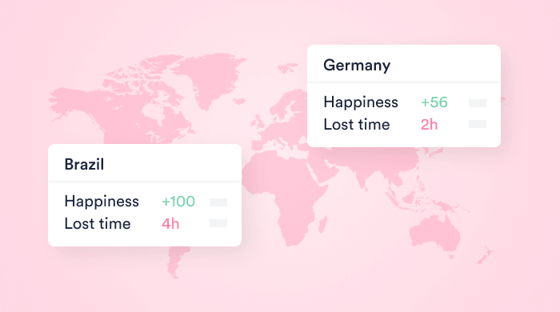
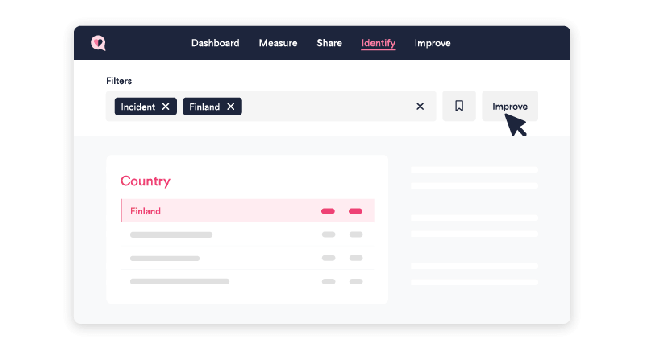
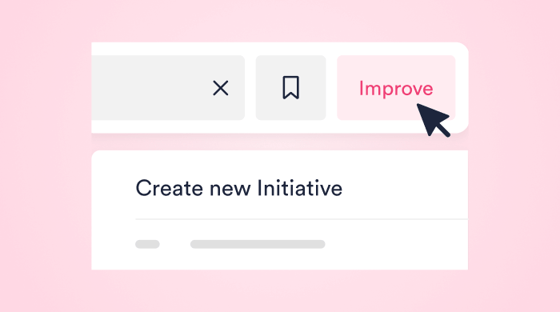
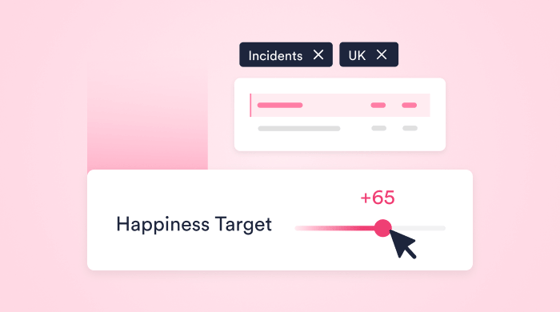
HappySignals IT Experience Management Platform enables you to truly place your end-users at the center of IT. Get experience insights and make data-driven decisions to improve across different IT areas:


Ticket-based Services, Overall IT Experience, Enterprise Applications, Laptops and Computers, Mobile Devices, Collaboration with IT, Office Environment, Remote Work, and Service Portal.

ITXM-platform-2_tiny2

Leading ITXM Platform

For IT leaders and teams, HappySignals offers full capabilities to bring the IT Experience Management Framework™ (ITXM) into your daily work.


Learn more about ITXM

Measure-final-1

Measure end-user experiences across all IT touchpoints in real time

Understand where and why your end-users are unhappy or losing time. Use ticket-based and proactive surveys to continuously measure all of IT.
Measure_Quantify Happiness Productivity-3

Quantify
Happiness & Productivity

End-users rate their happiness and tell how much productive work time they lost with just a few clicks.
Measure_Reasons-1

Understand the reasons behind each rating

Don’t stop at a number. Find out why end-users are happy or unhappy, so you know how to improve your services.
Measure_continuous-1

Continuous stream of data

Do better than yearly surveys. Automate the continuous sending of ticket-based and proactive surveys at the right times to the relevant end-users.
Reliable-final-1

Get reliable, comparable, and repeatable data with ready-made surveys

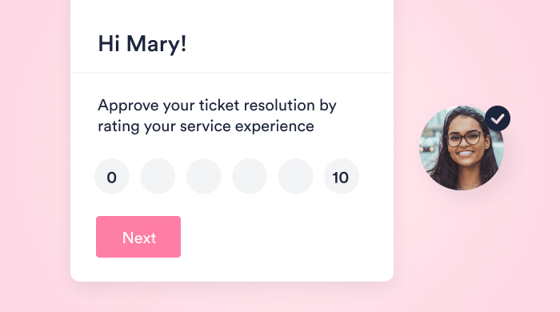
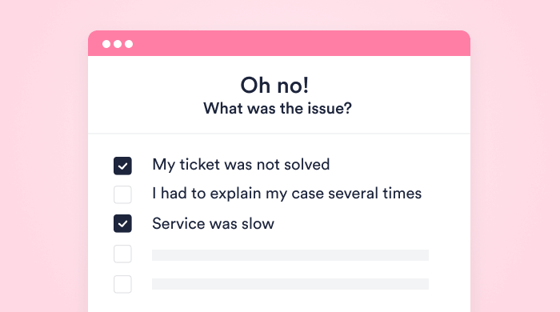
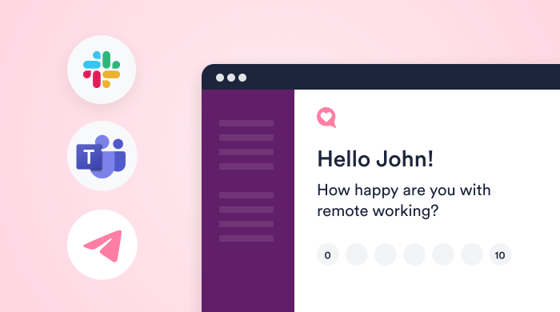
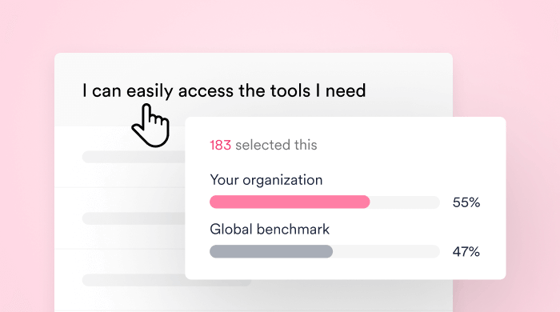
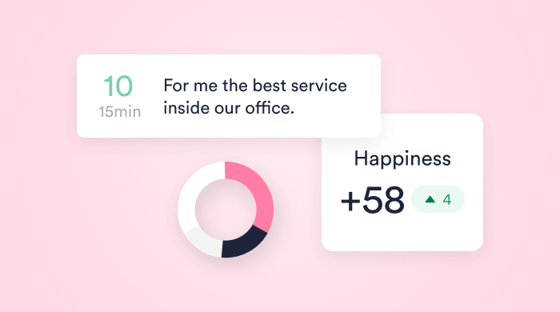
Start collecting experience data in days! Drive high response rates and get actionable data with research-backed and standardized surveys.

Measure_Surveys

Out-of-the-box Surveys backed by research

Why spend time creating surveys from scratch? Use our ready-made surveys that have been designed and tested with end-users.
Measure_Survey Channels-1

Surveys via Email, Microsoft Teams, or Slack

Make it easy for end-users to give feedback using their everyday internal communication tools.
Measure_comparable

Comparable data internally and globally

Using data from standardized surveys, compare end-user experiences within your organization and with global benchmarks.
Share-final

Share real-time data and get everyone on the same page

Easily share experience data openly with your colleagues, partners, and business stakeholders. Build trust and cooperation to reach common improvement goals.
Share_Automated Reporting-1

Automated Reporting

Get automated reports from HappySignals to easily share meaningful experience data and insights with IT and business stakeholders.
Share_Live Screens-1

Live Screens in your workplace

Create digital signage with selected experience data. Make Experience a common focus and talking point between colleagues.
Share_Feedback Loop

Instant Feedback Loop for IT

Enable everyone in IT, from Service Agents to Service Owners, to see the impact of their work on end-users with real-time feedback.
Identify-final-1

Identify focus areas by drilling down into the experience data

From the big picture to a detailed view in a few clicks. Focus on the time periods, Measurement Areas, Locations, Services etc that matter most to you.
Identify-Drill Down

Intuitive drill-down analytics

Drill down into experience and operational data in a few clicks to identify critical areas across services, locations, channels, vendors, and more.
Identify-Feedback-2

Factors and Feedback

Understand the top reasons why end-users are unhappy. Save time from processing free text feedback with NLP auto-tagging.
Identify-Benchmark-1

Global Benchmarks

Compare IT in your organization with other HappySignals users globally. Account for cultural differences in rating behavior.
Improve-final-1

Improve what matters most with data-driven decisions

Drive continuous improvement with actionable data – no more gut feelings! Allocate resources to the right places to achieve business outcomes.
Improve_Initiatives

Initiatives

Start improvement projects and track progress towards targets. Quantify the impact on end-user experience.
Improve_XLA

Built-in XLA Management

Set and follow experience level targets. Ensure your teams and partners are driven by metrics that put end-users first. More
cumulative-productivity-gains

Productivity Measurement

Get a real-time view into where people lose most of their productivity and quantify the cumulative productivity gains that IT's actions have brought. More
use_cases_thumbnail_

One platform, many solutions

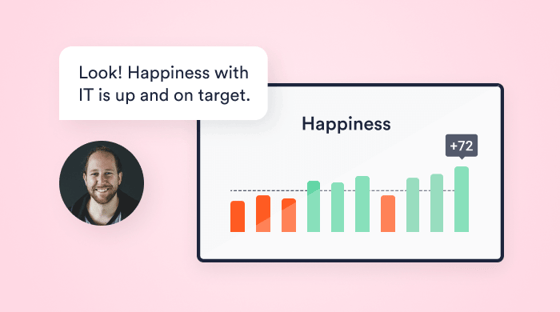
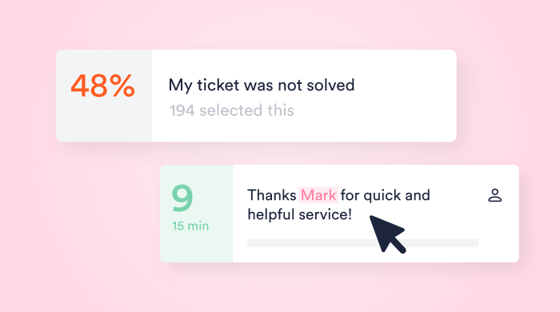
Regardless of your role in IT, HappySignals helps you to tackle common IT challenges, from fixing the watermelon effect to eliminating manual reporting.

Discover Solutions


One platform for every step of ITXM

Watch this short demo to see how it all comes together on HappySignals


Watch Platform Deep Dive (4 min)


Download Product Overview

Get your pdf-summary of the HappySignals ITXM Platform

Ready to drive IT Experience Management in your organization?

Let's talk!


Book a 30-min meeting to discuss your challenges and how Experience Management can help.

Get in Touch
See how HappySignals Platform works

Watch Demo
HappySignals Platform

Ready to get started?

Contact Sales

Contact Sales